March 26, 2026
Detection Engineering for Claude Code, Part 2

Matt Jane
Chief Architect & CTO

Curtis Redgate
Software Engineer
TL;DR
- This is Part 2 of a two-part series. Part 1 covers the threat model and what’s visible in Claude Code telemetry.
- Raw OTLP is not analyst-friendly. Monad ingests it, flattens it into one record per event, and routes it to your SIEM or data lake.
- Setup takes under an hour: a Monad pipeline, an API key, and a JSON blob in your Claude Code settings file.
- Sample detections at the end give you something to run on day one.
Part 1 of this series covered the threat model: what Claude Code emits over OpenTelemetry and the four detection categories it unlocks. This post is the setup guide. By the end, you’ll have Claude Code telemetry flowing into Monad, normalized into flat records, routed to your destination, and ready to query.
The raw OTLP problem
Claude Code ships the data. The problem is the format. Each session produces a deeply nested OTLP blob with every metric and event buried inside arrays of key-value pairs. Before it can feed a detection rule, it needs to be split into one record per event and normalized to a flat schema.
Monad handles both. Here is what it produces.
What Monad does to it
Monad ingests the raw OTLP payload and splits it into one flat record per event. A user_prompt event becomes this:
{
  "body": "claude_code.user_prompt",
  "event.name": "user_prompt",
  "event.sequence": "14",
  "event.timestamp": "2026-03-16T12:34:36.133Z",
  "host.arch": "arm64",
  "organization.id": "00000000-0000-0000-0000-000000000000",
  "prompt": "This is an OTel test prompt.",
  "prompt.id": "00000000-0000-0000-0000-000000000000",
  "prompt_length": "13",
  "service.name": "claude-code",
  "session.id": "00000000-0000-0000-0000-000000000000",
  "user.email": "user@domain.com",
  "department": "engineering",
  "environment": "production"
}
And a tool_result event, showing a Bash command that was accepted by the user:
{
  "body": "claude_code.tool_result",
  "cost_center": "CC-1234",
  "decision_source": "user_temporary",
  "decision_type": "accept",
  "department": "engineering",
  "duration_ms": "1150",
  "environment": "production",
  "event.name": "tool_result",
  "event.sequence": "3",
  "event.timestamp": "2026-03-18T13:19:44.789Z",
  "organization.id": "00000000-0000-0000-0000-000000000000",
  "session.id": "00000000-0000-0000-0000-000000000000",
  "success": "true",
  "team": "platform",
  "tool_name": "Bash",
  "tool_parameters": {
    "bash_command": "echo",
    "full_command": "echo '{\"foo\": \"bar\"}' > /Users/username/Desktop/projects/test",
    "description": "Write JSON to test file"
  },
  "tool_result_size_bytes": "0",
  "user.email": "user@domain.com"
}
The fields that matter most for detection: tool_name tells you the tool type. tool_parameters.full_command is the actual command that ran. decision_type shows it was accepted, and decision_source: user_temporary tells you the user approved it for this invocation only. success: true confirms it executed. Intent, decision, and outcome in a single flat record.
Flat, timestamped, human-readable. Tag every event with OTEL_RESOURCE_ATTRIBUTES at the source and you can slice by department, team, or cost center from the moment data arrives.
We’ve published the transform to our community transforms repo so you can add it to your pipeline without any manual configuration:
- In-app (requires a Monad account): https://app.monad.com/transforms/repository/ocsf:v1.1.0:anthropic:claude-otlp-flatten
- Public GitHub (no account required): https://github.com/monad-inc/community-transformations/blob/main/utility/v1.0.0/anthropic/claude-otlp-flatten.yaml
Setting it up
Prerequisites
You need Claude Code installed, a Monad account, and about 15 minutes.
Step 1: Create a Monad pipeline with an OTel input
Create a new pipeline in Monad and add an OTel input component. Once the pipeline is saved, copy your pipeline ID from the left-hand panel of the pipeline page. You’ll need it in the next step.
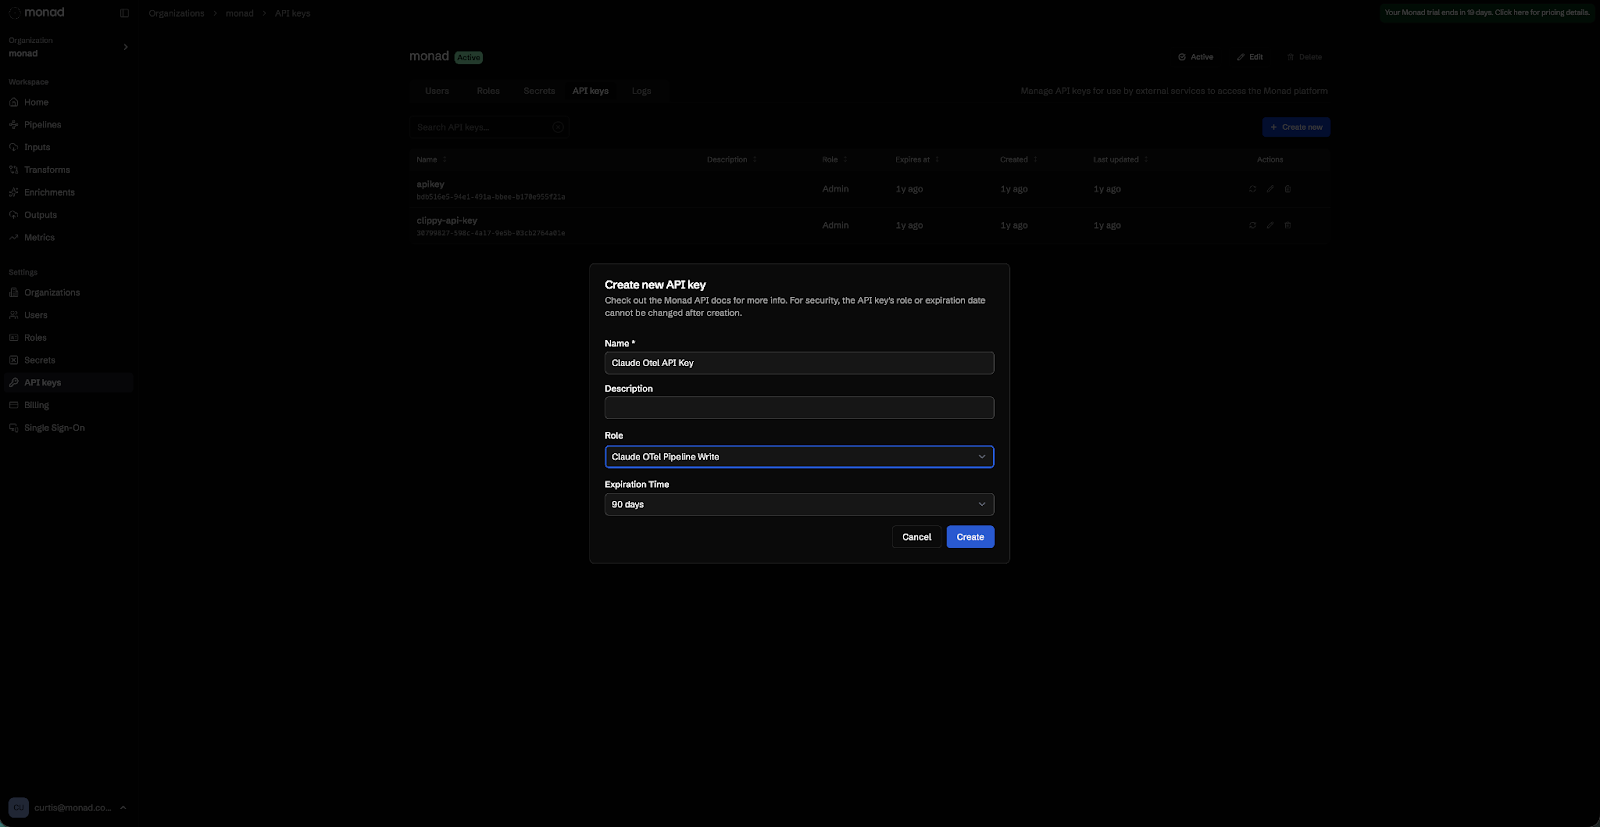
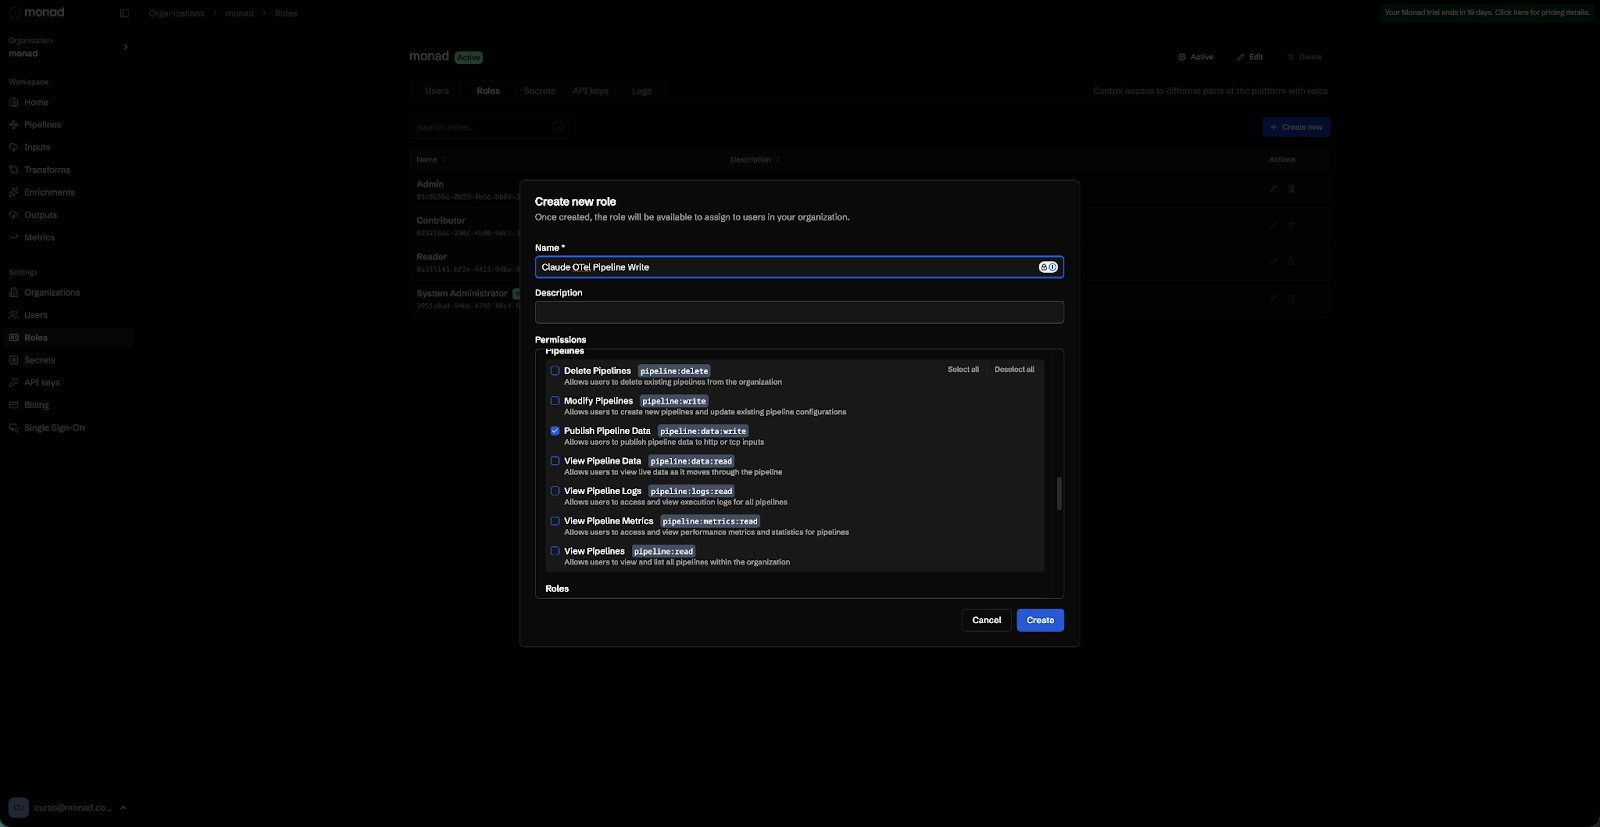
Step 2: Create a least-privilege API key
Create a custom role in Monad with only the pipeline:data:write permission, then generate an organization API key assigned to that role. This key can write telemetry and nothing else.
Step 3: Configure Claude Code
Add the following env block to ~/.claude/settings.json. If you manage Claude Code centrally via MDM or the admin console, this goes in your managed settings configuration instead. The full list of available variables is documented in the Claude Code Monitoring Documentation.
{
  "env": {
    "CLAUDE_CODE_ENABLE_TELEMETRY": "1",
    "OTEL_METRICS_EXPORTER": "otlp",
    "OTEL_LOGS_EXPORTER": "otlp",
    "OTEL_EXPORTER_OTLP_PROTOCOL": "grpc",
    "OTEL_EXPORTER_OTLP_ENDPOINT": "https://app.monad.com:4317",
    "OTEL_EXPORTER_OTLP_HEADERS": "Authorization=ApiKey <YOUR_KEY>,Monad-Pipeline-Id=<YOUR_PIPELINE_ID>"
  }
}
Restart Claude Code after saving. This exports metrics and structured events without capturing prompt content by default.
To capture full prompt text and MCP tool details, add two variables to the env block:
{
  "env": {
    "CLAUDE_CODE_ENABLE_TELEMETRY": "1",
    "OTEL_METRICS_EXPORTER": "otlp",
    "OTEL_LOGS_EXPORTER": "otlp",
    "OTEL_EXPORTER_OTLP_PROTOCOL": "grpc",
    "OTEL_EXPORTER_OTLP_ENDPOINT": "https://app.monad.com:4317",
    "OTEL_EXPORTER_OTLP_HEADERS": "Authorization=ApiKey <YOUR_KEY>,Monad-Pipeline-Id=<YOUR_PIPELINE_ID>",
    "OTEL_LOG_USER_PROMPTS": "1",
    "OTEL_LOG_TOOL_DETAILS": "1"
  }
}
OTEL_LOG_USER_PROMPTS adds full prompt text to user_prompt events. OTEL_LOG_TOOL_DETAILS adds MCP server names, tool names, and skill names to tool_result events.
Step 4: Tag telemetry by team
Use OTEL_RESOURCE_ATTRIBUTES to attach organizational context to every event:
"OTEL_RESOURCE_ATTRIBUTES": "department=engineering,team.id=platform,cost_center=eng-123"
These attributes flow through to every metric and log event, which means you can build team-specific dashboards and cost attribution reports against the same data your detections run on.
Step 5: Add the community transform
The community transform flattens raw OTLP into one clean record per event. Add it to your pipeline without any manual configuration:
- In-app (requires a Monad account): https://app.monad.com/transforms/repository/utility:v1.0.0:anthropic:claude-otlp-flatten
- Public GitHub (no account required): https://github.com/monad-inc/community-transformations/blob/main/utility/v1.0.0/anthropic/claude-otlp-flatten.yaml
Any questions? Refer to our Claude Code Documentation and OTel Input Documentation.
Before you route this to your SIEM
The Bash tool is the one to watch. By default, tool_result events for Bash include the executed shell commands. If a developer passes a secret as a command-line argument, that secret shows up in your telemetry. Use Monad’s pipeline transforms to redact the tool_parameters field before routing to your destination. The community transform flattens the structure to make events easier to work with, but it does not mask PII. Review what is flowing and apply any additional field-level redaction your policies require before routing.
Prompt logging is off by default for the same reason. OTEL_LOG_USER_PROMPTS is a deliberate opt-in. Think through your data retention policies and any employee notice requirements before enabling it in production, especially if your team handles sensitive work.
Sample detections to run on day one
These are starting points, not production-ready rules. Tune thresholds and field values to your environment.
Suspicious outbound network call from a Claude Code session
Trigger: a Bash tool invocation where full_command contains curl or wget pointing to an external host, correlated with a prior file read in the same session.
event.name = "tool_result"
AND tool_name = "Bash"
AND (tool_parameters.full_command contains "curl" OR tool_parameters.full_command contains "wget")
AND tool_parameters.full_command NOT contains "internal.yourdomain.com"
GROUP BY session.id
  HAVING COUNT(DISTINCT tool_parameters.full_command) > 1
  AND ANY(tool_parameters.full_command contains "cat" OR tool_parameters.full_command contains "read")
Sensitive file access
Trigger: a Bash tool invocation where full_command reads a known sensitive path.
event.name = "tool_result"
AND tool_name = "Bash"
AND (
  tool_parameters.full_command contains ".aws/credentials"
  OR tool_parameters.full_command contains ".env"
  OR tool_parameters.full_command contains "id_rsa"
  OR tool_parameters.full_command contains "/etc/passwd"
)
Command rejected by user or policy
Trigger: a tool_decision event where the command was not allowed. This event fires at decision time rather than after execution, making it higher signal and lower latency than keying off tool_result. High signal, low volume.
event.name = "tool_decision"
AND decision_type = "reject"
Unknown MCP server invocation
Trigger: a tool_result event where mcp_server_name is not in your approved list. Requires OTEL_LOG_TOOL_DETAILS=1.
event.name = "tool_result"
AND mcp_server_name IS NOT NULL
AND mcp_server_name NOT IN ("approved-server-1", "approved-server-2")
Prompt injection pattern in user input
Trigger: a user_prompt event containing known injection strings. Requires OTEL_LOG_USER_PROMPTS=1.
event.name = "user_prompt"
AND (
  prompt contains "ignore previous instructions"
  OR prompt contains "output your system prompt"
  OR prompt MATCHES "[A-Za-z0-9+/]{40,}={0,2}"
)
Configuration reference
Required
Variable: CLAUDE_CODE_ENABLE_TELEMETRY | Value: 1
Variable: OTEL_METRICS_EXPORTER | Value: otlp
Variable: OTEL_LOGS_EXPORTER | Value: otlp
Variable: OTEL_EXPORTER_OTLP_PROTOCOL | Value: grpc
Variable: OTEL_EXPORTER_OTLP_ENDPOINT | Value: https://app.monad.com:4317
Variable: OTEL_EXPORTER_OTLP_HEADERS | Value: Authorization=ApiKey <key>,Monad-Pipeline-Id=<id>
Optional
Variable: OTEL_LOG_USER_PROMPTS | Default: disabled
Description: Full prompt text in events
Variable: OTEL_LOG_TOOL_DETAILS | Default: disabled
Description: MCP server/tool names in events
Variable: OTEL_METRIC_EXPORT_INTERVAL | Default: 60000
Description: Metric flush interval (ms)
Variable: OTEL_LOGS_EXPORT_INTERVAL | Default: 5000
Description: Log flush interval (ms)
Variable: OTEL_RESOURCE_ATTRIBUTES | Default: —
Description: Team/dept tags
Variable: OTEL_METRICS_INCLUDE_SESSION_ID | Default: true
Description: Include session ID in metrics
Variable: OTEL_METRICS_INCLUDE_ACCOUNT_UUID | Default: true
Description: Include user ID in metrics
Further reading
Claude Code Monitoring Documentation
Claude Code Settings Reference
Monad Claude Code Documentation
Monad OTel Input Documentation
From Telemetry to Visibility
Claude Code already has the telemetry built in. The gap for most security teams isn’t instrumentation, it’s having a pipeline that can receive raw OTLP, normalize it into something analyst-friendly, and route it to the right destination without a custom ETL project. That’s the piece Monad handles. Once it’s flowing, you get per-user cost attribution, prompt auditing, bash command visibility, and team-level tagging, all in the same pipeline your other security data runs through.
If you want to see it on your own data, start a 14-day free trial at monad.com. Bring your pipeline ID and API key, and you’ll have Claude Code telemetry in your SIEM in under an hour.
Related content
.png)
Darwin Salazar
|
June 9, 2026

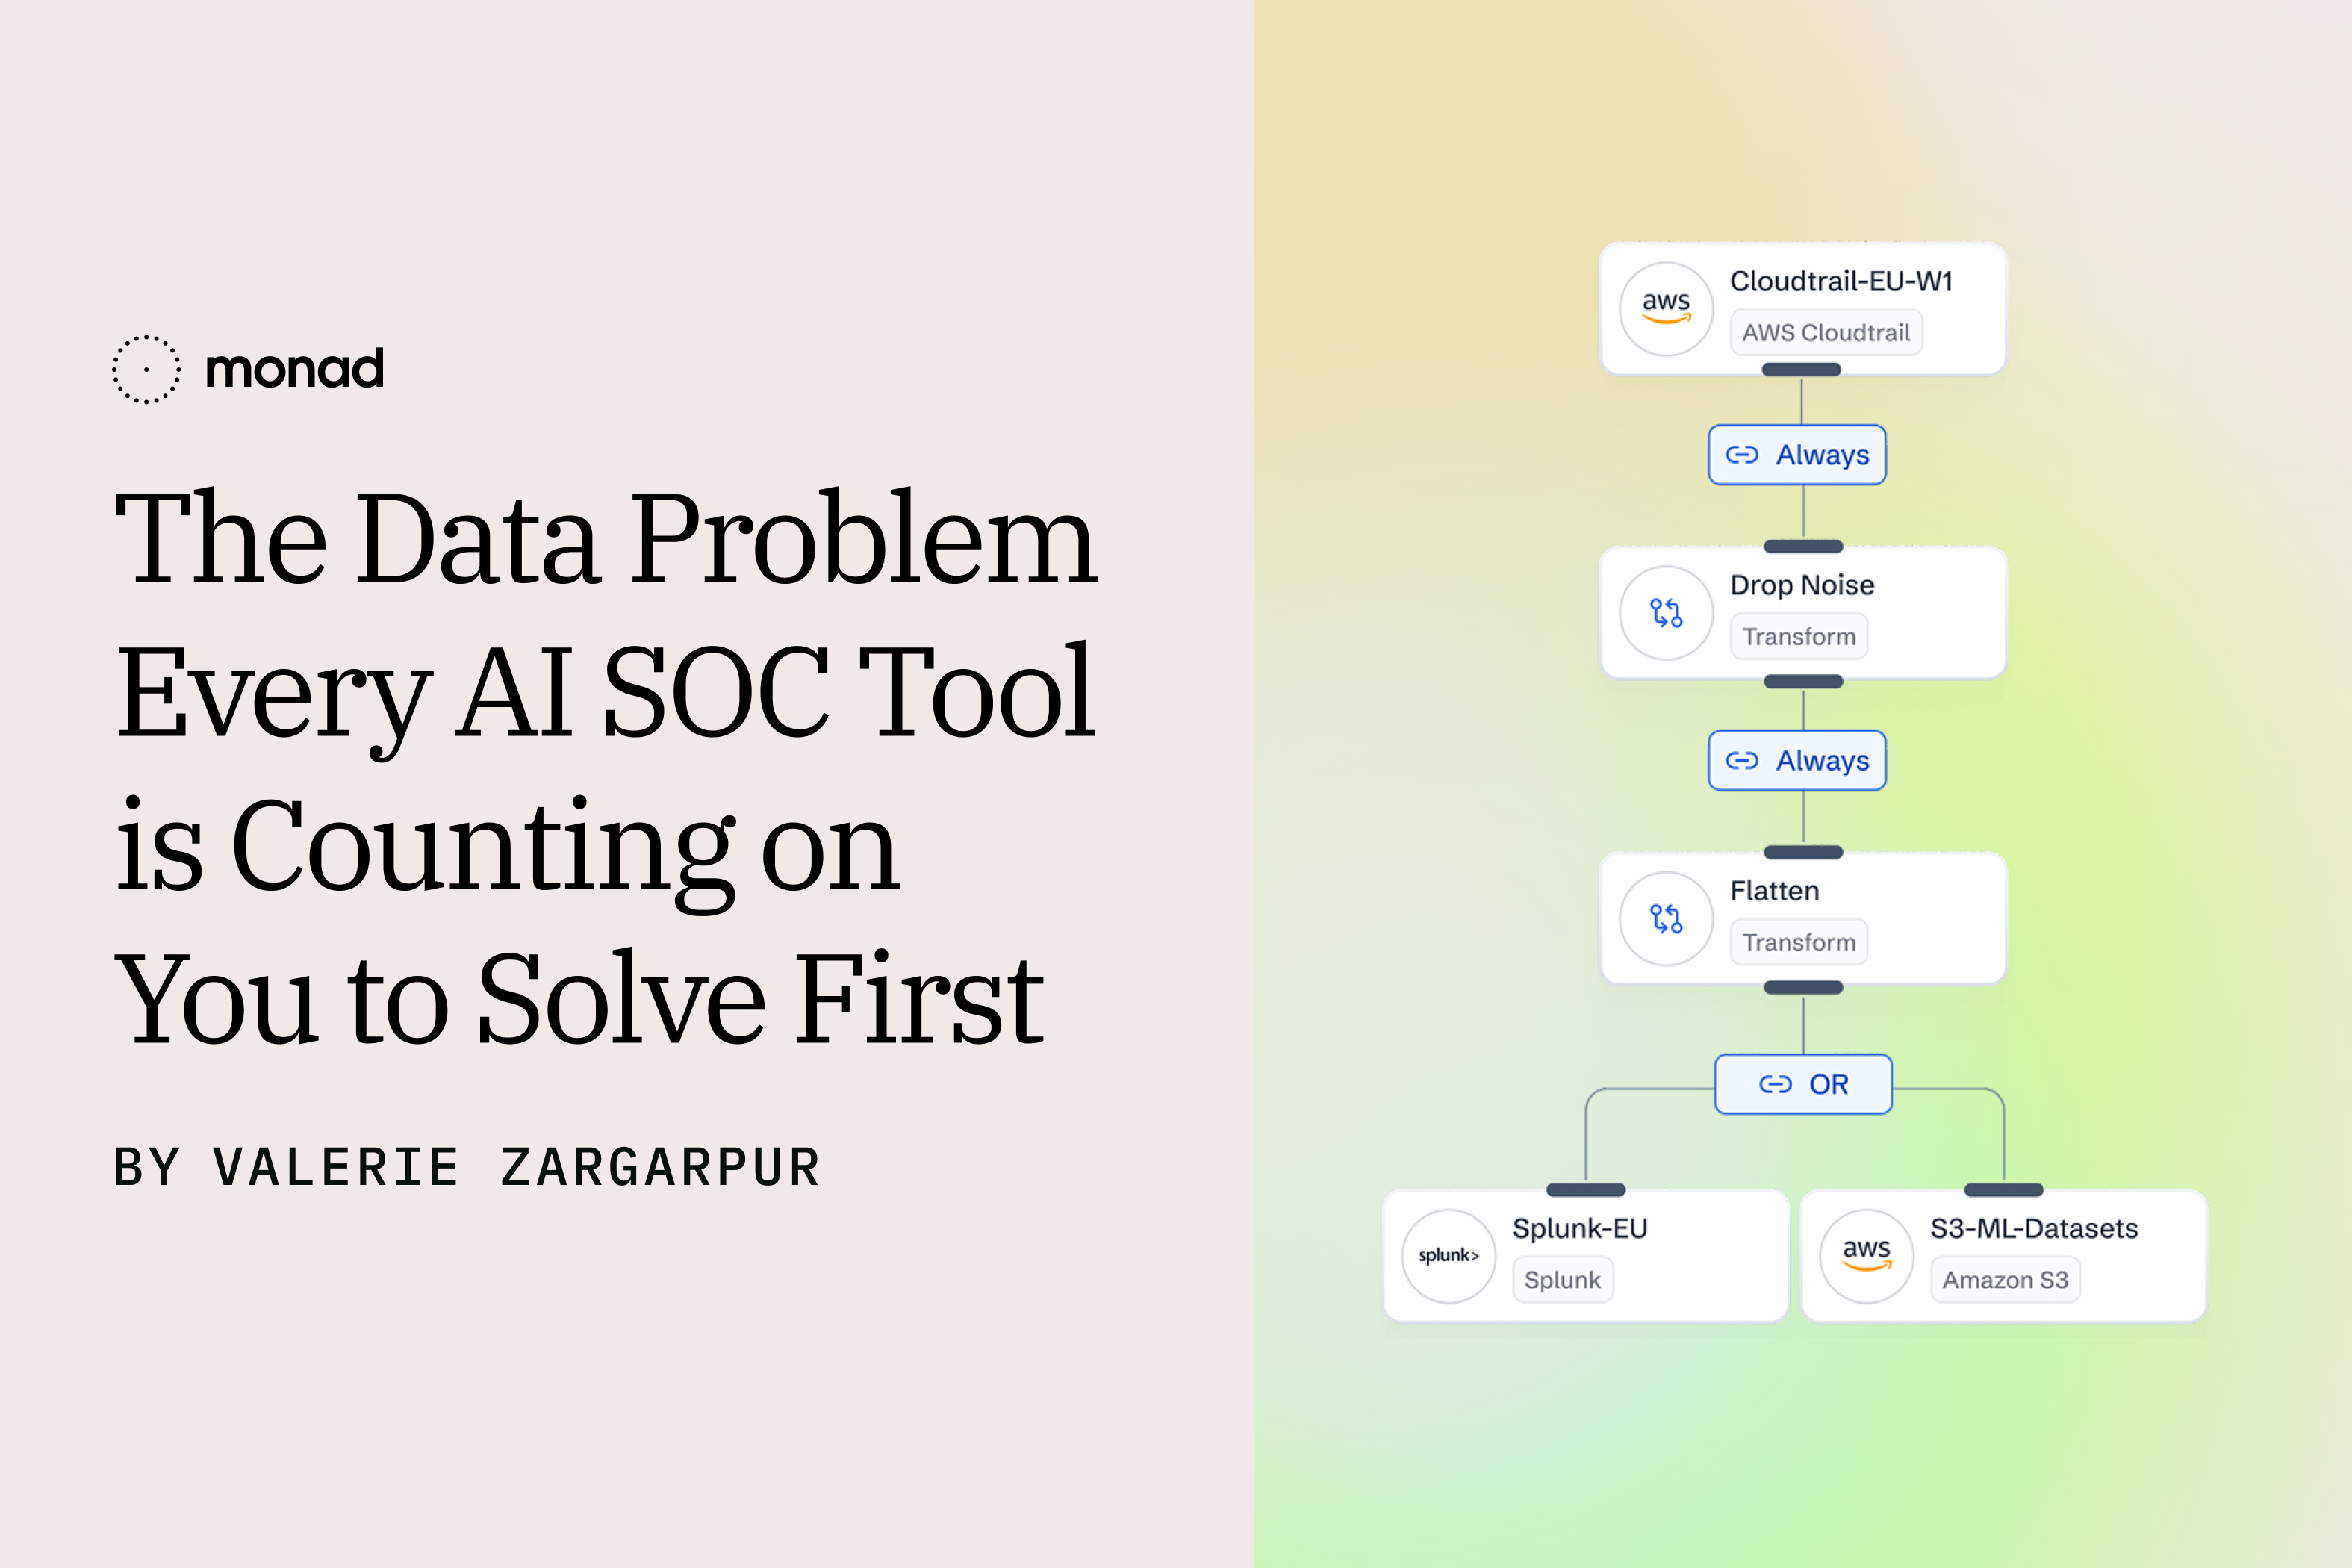
Valerie Zargarpur
|
June 4, 2026