April 28, 2026
Your SIEM Bill Is a Lagging Indicator. Introducing Storage Cost Analysis in Monad.

Valerie Zargarpur
Head of Marketing
Most security teams find out what their data costs the same way: a renewal conversation, a line item that went up 40%, and a scramble to explain why. By that point, the data has already been stored, the bill is set, and the volumes that drove the cost up have only grown since.
The problem is not that teams aren't paying attention. It's that the information was never easy to see in the first place. You know data is flowing into Datadog, Splunk, S3, and a handful of other destinations. But most SIEM and log management tools were not built to show you what that data costs on an ongoing basis. The visibility simply isn't there, and by the time an invoice arrives, the window to do anything about it has already closed.
Storage cost analysis is a new feature in Monad that surfaces that number directly from your pipeline data.
What it shows you
Storage cost analysis gives you a per-destination breakdown of what your data costs, comparing unfiltered ingestion volume against what Monad actually sends to each output after filtering and transformation.
You enter your contracted storage price per GB for each destination. Monad does the rest: it measures the data volume entering each pipeline and the volume reaching each output, then calculates what you would have paid without filtering versus what you're paying with it. The cost numbers are estimates based on the prices you configure, not a guarantee, but they are grounded in your actual pipeline throughput.
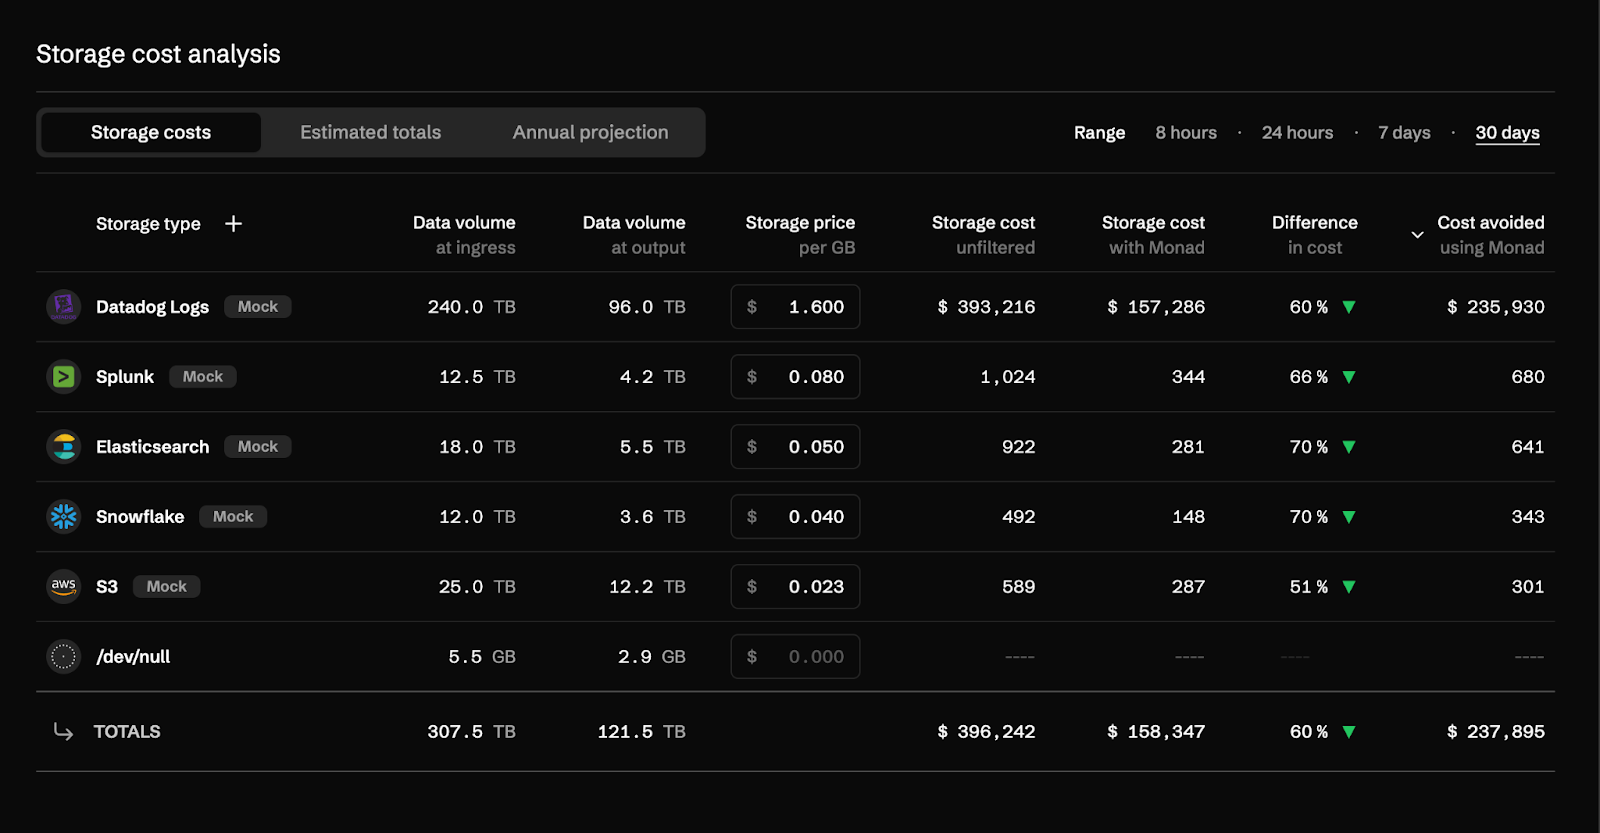
The table above shows storage costs across five destinations. In this example, Datadog Logs sees 240 TB at ingress and 96 TB at output, a 60% reduction, with an estimated cost avoided of $235,930 over 30 days. Across all destinations, the total cost avoided is $237,895 on $396,242 of unfiltered spend.
You can adjust the time range to 8 hours, 24 hours, 7 days, or 30 days, which is useful for spotting recent pipeline changes or validating that a new filter rule is actually doing what you expect.
The summary view
The estimated totals tab distills the per-destination numbers into three figures: what it would cost to store your data unfiltered, what it costs with Monad's pipelines applied, and the difference.
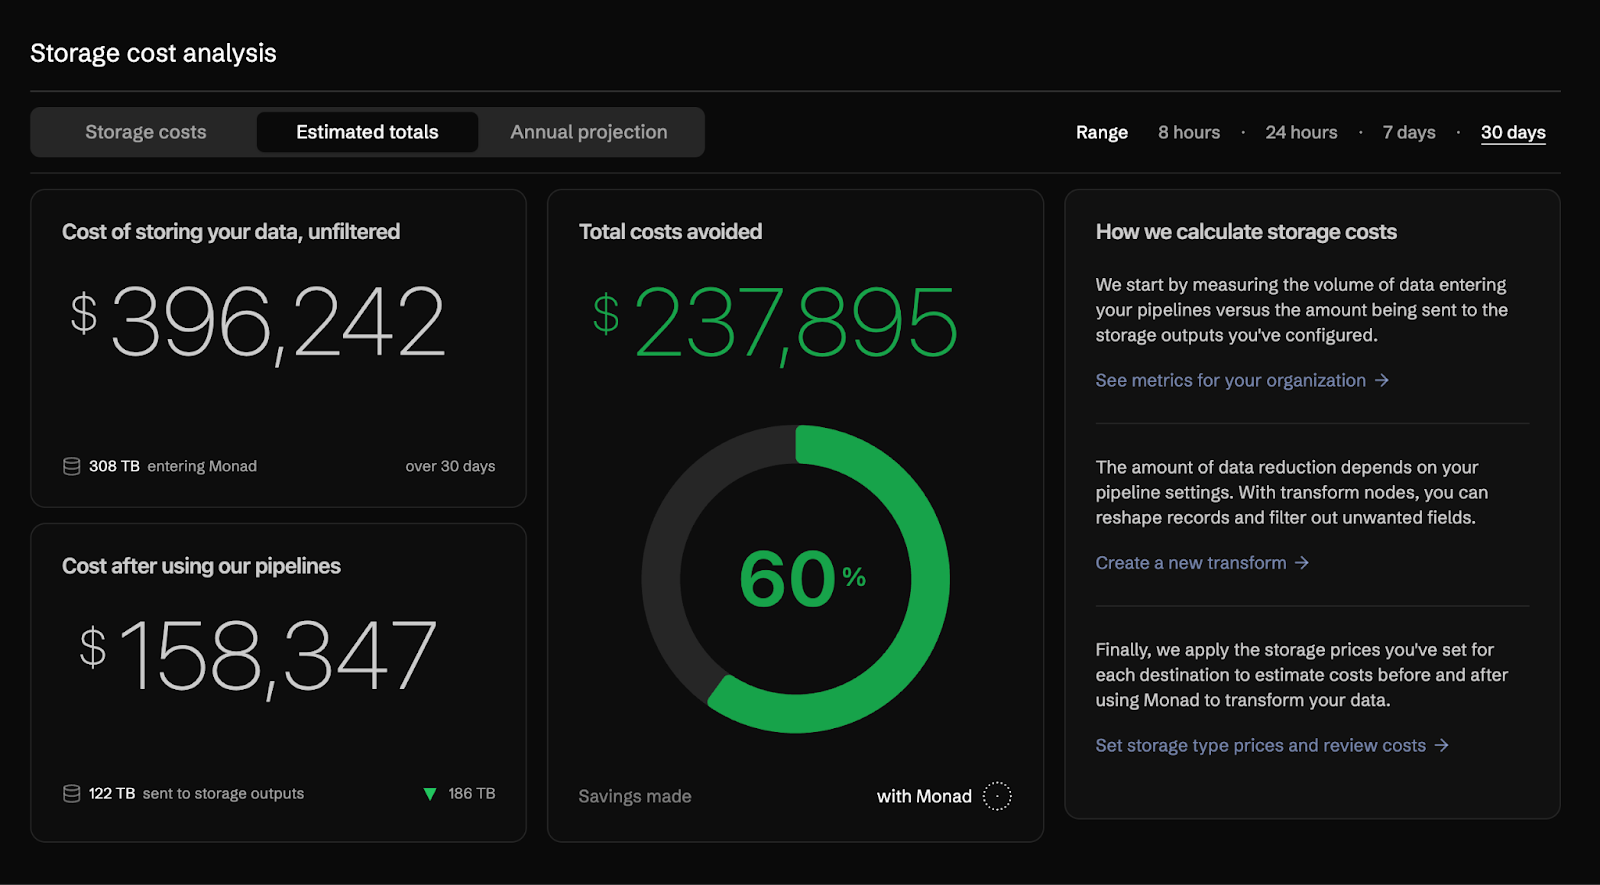
In this example, 308 TB entered Monad over 30 days. After filtering, 122 TB reached storage destinations. That 60% reduction translates to $237,895 in estimated avoided costs for the period.
The methodology is visible in the same view. Monad measures ingress versus output volume per destination, applies the storage price you've set, and aggregates the totals. If you want to adjust a destination's price or add a new one, you can do it from the same screen.
Annualized projection
The annual projection tab takes your current 30-day throughput and projects it forward, showing cumulative filtered and unfiltered costs month by month.
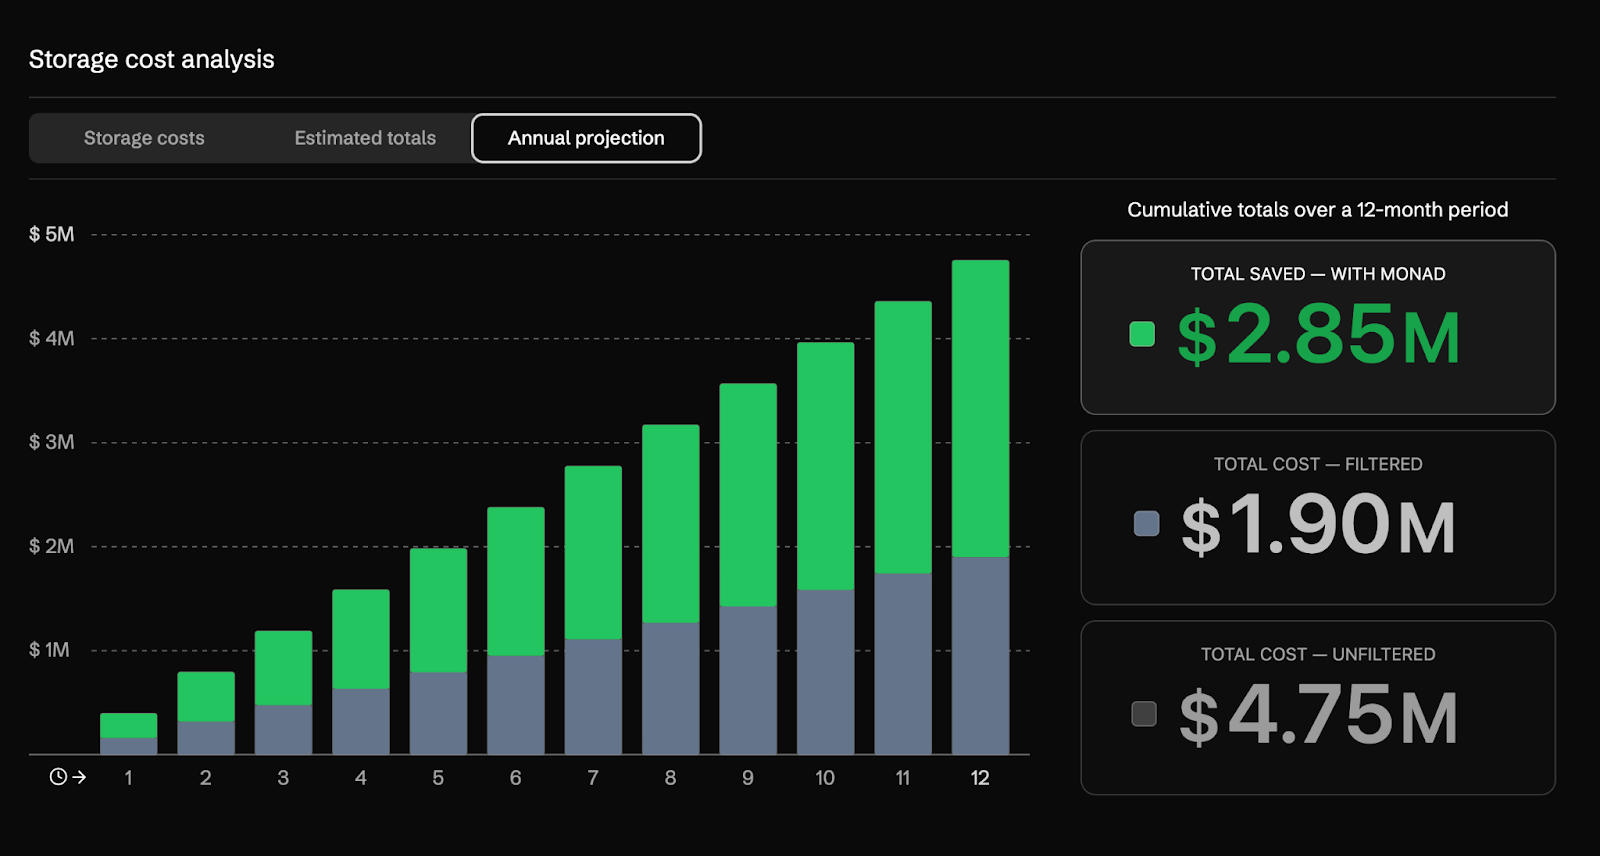
This view is built for the conversations that happen around budget and renewal. If your data volume is growing, the chart reflects that trajectory. In this example, the 12-month projection shows $4.75M unfiltered, $1.90M filtered, and $2.85M in estimated costs avoided over the year.
Those numbers are estimates. They are based on your current volume, your configured prices, and the assumption that pipeline behavior stays roughly consistent. But they give you something concrete to work with when someone asks what the pipeline is actually saving.
Availability
Storage cost analysis is now in public beta. If you're already a customer, you'll find it in your workspace in the side panel under Storage Costs.
If you're not yet using Monad and want to see how it would apply to your environment, you can get started for free with a 14-day trial, or schedule a demo at monad.com. You can also reach us directly at product@monad.com.
Related content
.png)
.png)
Darwin Salazar
|
July 16, 2026