October 26, 2026
Running With Scissors: Running Observable AI Agents on OpenShell

Matt Jane
Chief Architect & CTO
TL;DR:
We use AI agents for work involving sensitive systems. OpenShell enforces their permissions and records policy decisions, but we needed that telemetry outside the sandbox to investigate failures and understand behavior across runs. To close the gap, we built an OTLP export path (now available upstream) and used Monad to normalize and route the data into our security tools.
Deploying autonomous agents
Like most teams right now, Monad is handing more and more of our work to AI agents. Some of that work comes with access to sensitive systems.
One of them is already part of our on-call rotation. A triage agent reads our infrastructure alerts, pulls context from Grafana and GitHub, and posts a summary to Slack, flags if it needs a response and even create a PR if it thinks the issue is fixable. The engineer on call starts with a working theory and code to review.
It's really REALLY useful. It's also an autonomous process with credentials to our observability stack, our source code, and our team's chat, making decisions that nobody is watching in real time.
We're a security data pipeline company, so naturally our first move is to make sure we can see what the agent is doing at all times.
What we need to know
Monad's whole job is getting telemetry out of the systems a security team depends on, shaping it into something usable, and delivering it to the places where people (or agents) detect, investigate, and respond. We do that for cloud logs, identity providers, endpoint tools, and SaaS apps and anything else that might be useful to security teams.
That includes agents. When they interact with production systems, we need the same visibility we expect from any other process. We need to be able to answer the same questions any detection or response engineer might ask about other production systems:
- What did it do, and what did it touch?
- What was it allowed to do, and what was it denied?
- Is it still working? Is it still completing the job we gave it?
- After the fact, what effect did it have?
The agent’s final answer can’t be the only evidence. If it fails silently, gets stuck, or behaves unexpectedly, its own report may be incomplete or never arrive.
We need a structured record that lives outside the agent’s sandbox, survives individual runs, and can be searched alongside the rest of our security data. That’s what lets us investigate one failure, spot patterns across many runs, and improve policies and instructions based on observed behavior.
So, why Openshell?
The first half of the problem is containment. We looked at the projects available for running agents securely and settled on NVIDIA's OpenShell. In our opinion, it's the best option out there for this kind of work.
OpenShell declares an agent's permissions as a policy and enforces them by a proxy underneath the agent, not by the agent's own restraint.
OpenShell also records every one of those decisions as a structured OCSF event: the agent, the destination, the method and path, the policy that matched, and the process that made the request.
That gave us the foundation: enforced boundaries and a record of what happened at those boundaries. For a security team, or anyone just wanting to understand what an agent is doing, that's exactly the data you want. But we had no way to extract the data that was already being generated.
The gap: great telemetry, no way out
OpenShell's built-in observability is designed for someone developing an agent: openshell sandbox logs oncall-triage --follow
On a laptop, that's the right tool. Running agents in production, we needed something different:
- Push, not pull. An agent on a five-minute cycle does its most interesting work while you're asleep. Someone shouldn't have to be holding a terminal.
- No cluster access required. The people who need to know what an agent did, like a security reviewer or an on-call responder, are exactly the people who shouldn't need
execinto the production cluster it runs in. - Every agent at once. "Which of our agents was denied something this week?" is a question about the fleet, not about one sandbox.
- Durable. Sandboxes are ephemeral by design. When one is recreated, its logs go with it, usually right before the moment you need them.
When we started, there was no native way to export the gateway's events to an outside system. So we built one. (OpenShell has come a long way since. More on that below.)
What we built: an OTLP exporter for OpenShell
We forked OpenShell and added an OpenTelemetry exporter. The gateway now ships everything it knows, for every agent it runs, over OTLP to any OpenTelemetry endpoint: its own logs and spans, every sandbox's logs, the OCSF enforcement events, and, when enabled, the agent's own output. The fork is public at monad-inc/OpenShell.
Because it speaks standard OTLP, it works with any collector or backend. For us, that endpoint is Monad.
Closing the Loop
Exporting the data was the first half of the job. The other half is the part Monad exists to do.
Monad receives the OTLP stream from the gateway like any other source. Nothing about the agents or the sandbox changes.
Reshape: delivery is not observability
Raw OTLP arrives as one document per batch. Attributes are stored as parallel key/value arrays and timestamps as text. In practice:
- Filtering by a single attribute, like
log.source == "sandbox", returns nothing useful. - Every time filter is meaningless, because the timestamp is a string.
In Monad, we use transforms to flatten the envelope into one record per log line, span, and metric point, with a real timestamp and attributes promoted to fields.
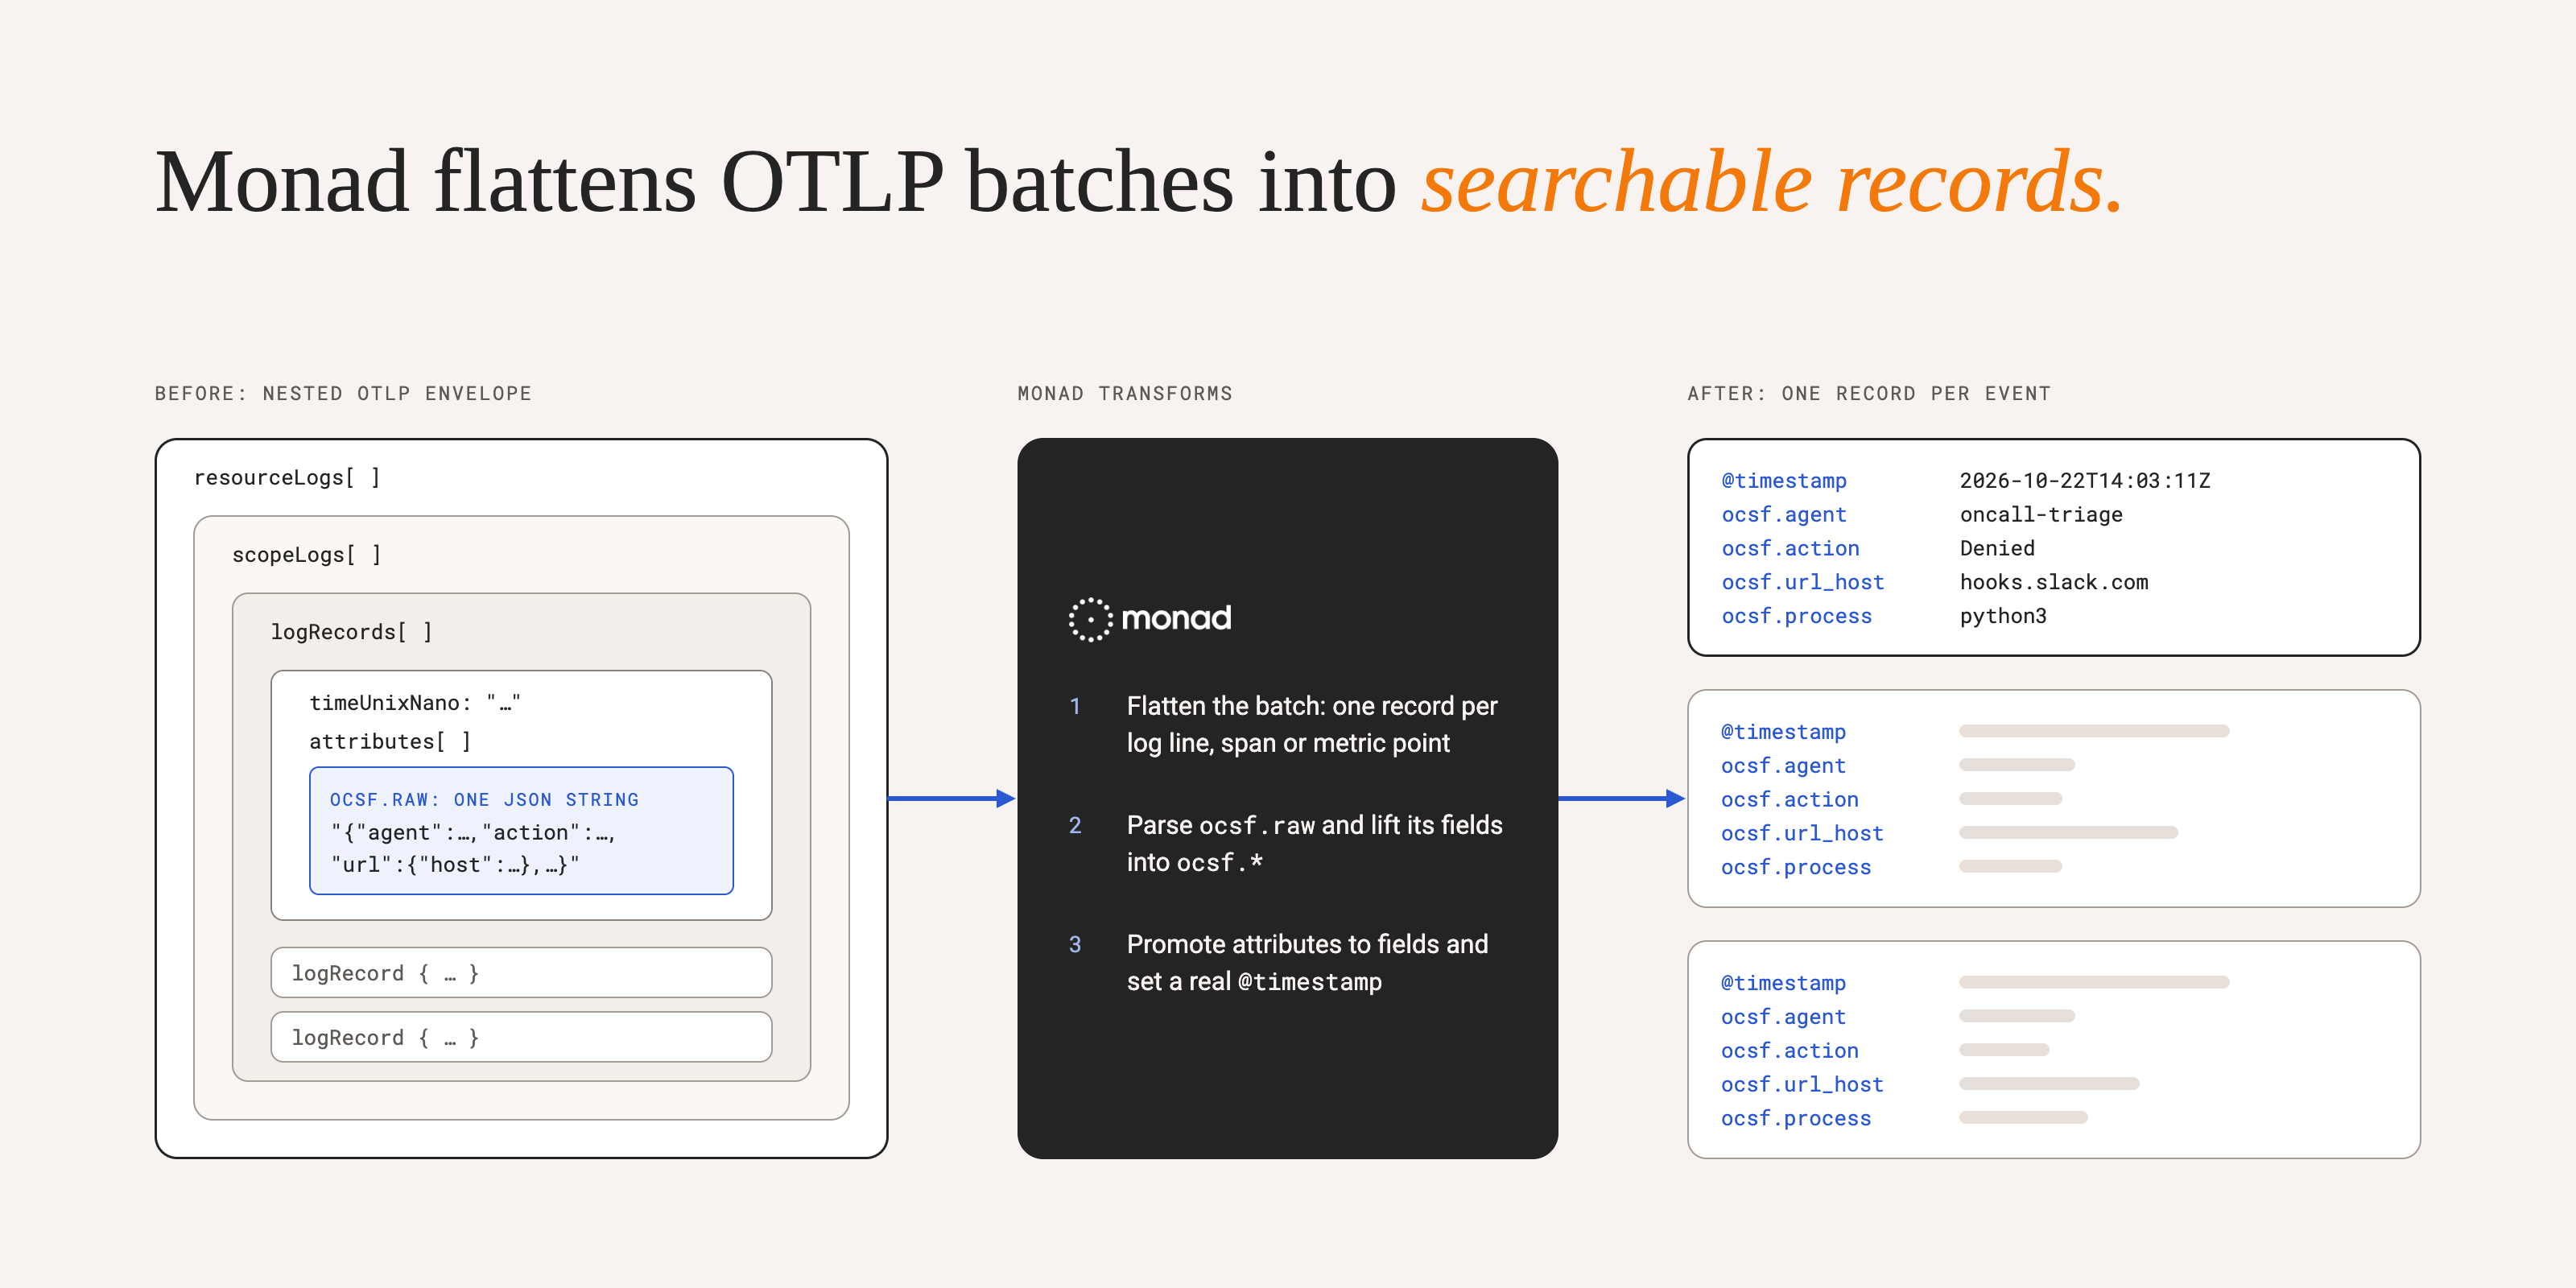
Then we went a step further. The fields that matter for security were still sealed inside the OCSF event as a single JSON string. Our exporter carries it as an ocsf.raw attribute. Upstream's carries it as the log body and promotes only the event's class, activity, severity and ID. You can full-text search a blob, but you can't group by one. So the pipeline lifts them out as first-class fields:
ocsf.agent        ocsf.sandbox_uid       ocsf.action
ocsf.policy       ocsf.policy_engine     ocsf.http_method
ocsf.url_host     ocsf.url_path          ocsf.process
That list isn't arbitrary. It's the vocabulary of the questions an operator asks: which agent, doing what, against what, allowed or not, under which rule.
Route
From Monad, the data goes to any of a number of outputs, and often 2 or more. For this project, we’re sending the data to Elasticsearch, where our security team already works in Kibana. Because routing is pipeline configuration, sending the same stream to a SIEM, a data lake for long-term retention, or an alerting tool doesn't require touching OpenShell or redeploying a single agent.
The result is a searchable datastore of ALL agent fleet activity and dashboards that sits next to every other board our security team watches. All available entirely out of band from the interactive log inspection needed when we started out.
What this enables
Agents are, by their very nature, dynamic and can utilize any tools that they see fit. That means, however, that we can often run into issues where a tool is denied or an agent attempts to do something which, either by design or by accident, is disallowed by its policy. If we are not interactively watching the logs, this is what we miss.
With the addition of the activity export via OTLP, we are now able to run analysis over the logs of what our agents are doing, report back, and make corrections to allow the agents to either reach something new or adjust the agent's instructions to better adhere to our controls.
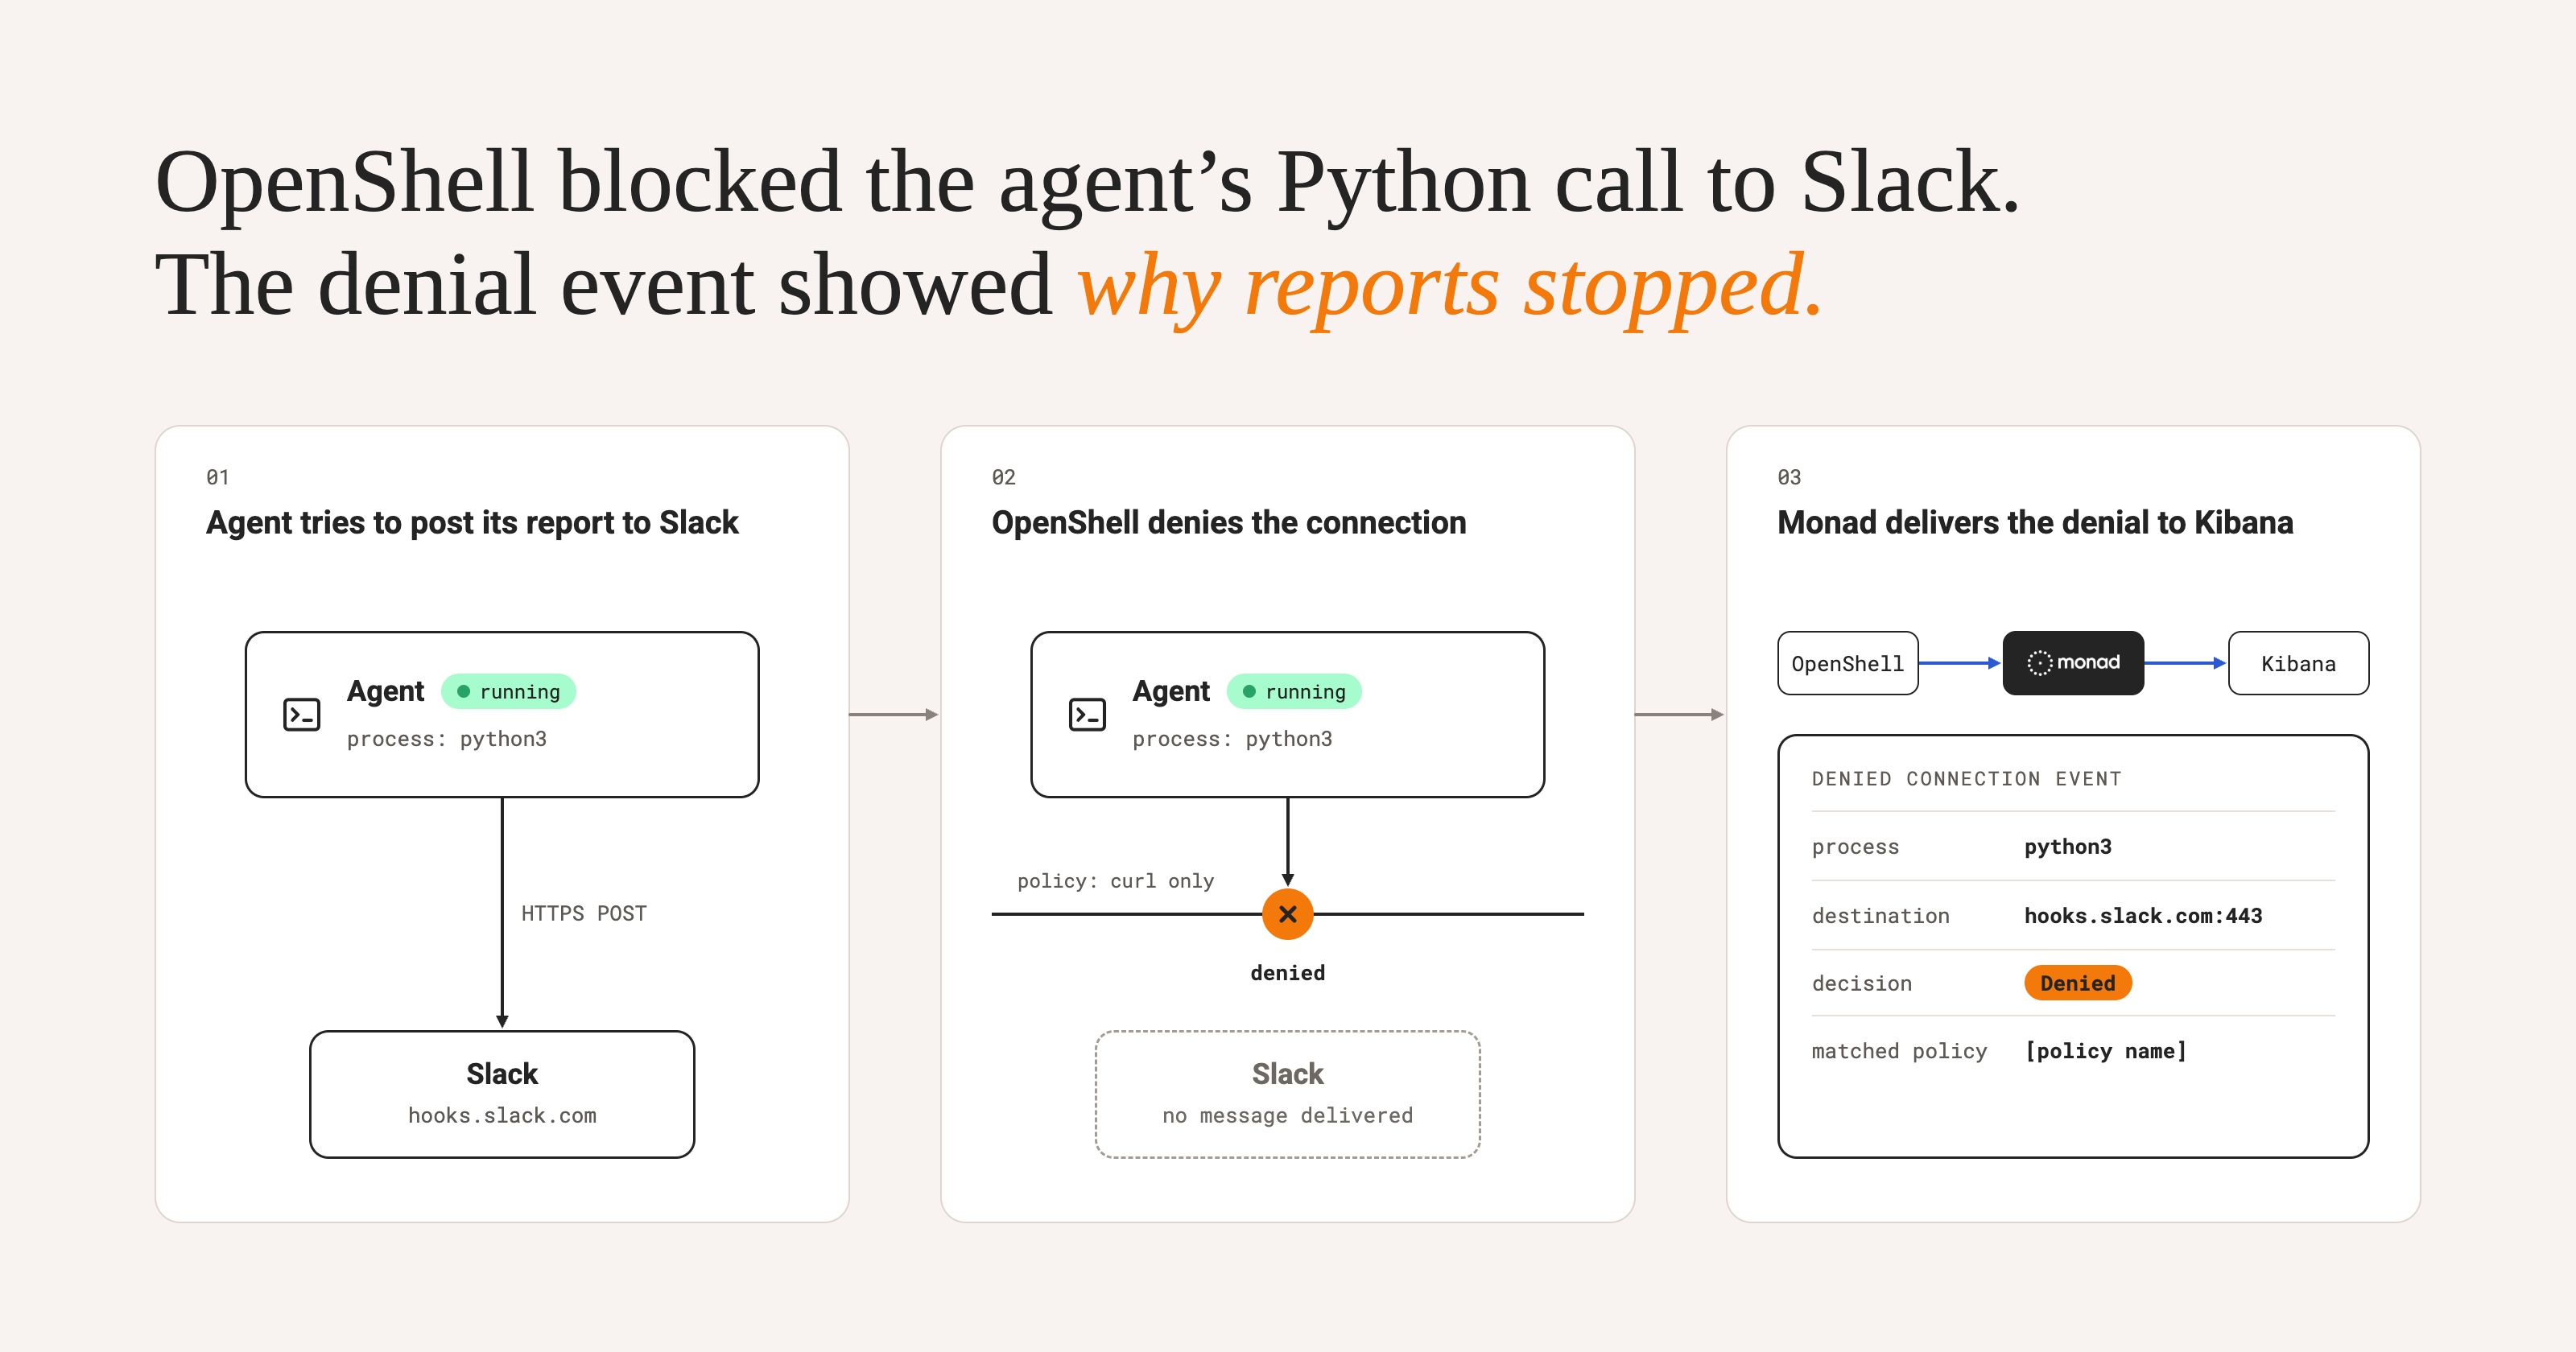
Shortly after deploying this we noticed that the agent was up and running but we weren't getting any output and it wasn't responding to any alerts that we were receiving. As it turned out he agent had written a Python script to post its report, and the policy only allowed curl. Posting to Slack is that agent's only output and its only memory, so a cycle that chose Python lost everything. Neither code review nor our deploy checks had found it.
The other side of this is perhaps the more difficult but also more important portion. Knowing what an agent has reached out to or tried to connect to is good but it is often something that we may or may not be able to really see when the agent is actively running. However when we can take these actions, aggregate them, and look at them over multiple runs, we can find that perhaps we have granted more permissions than expected (or that the agent is reaching out to something that we hadn't anticipated, or that there is a gap where permissions have been allowed where we otherwise would want it denied).
Because runs are non-deterministic this may not even show up every single run. It is only when collecting logs over multiple runs, over multiple invocations, and exporting this data that this picture truly becomes available to us.
Leveling Up
This is where telemetry stops being an audit trail and becomes a way to make agents better.
Agents are non-deterministic. No prompt guarantees the same path twice. That's their power, and it's also the problem: containment limits the damage on any given run, but it doesn't show you how the agent got there, and nobody can watch every cycle. With the record in place, we can:
- Review every action, by agent, across days and weeks, including the edge cases that only show up in production.
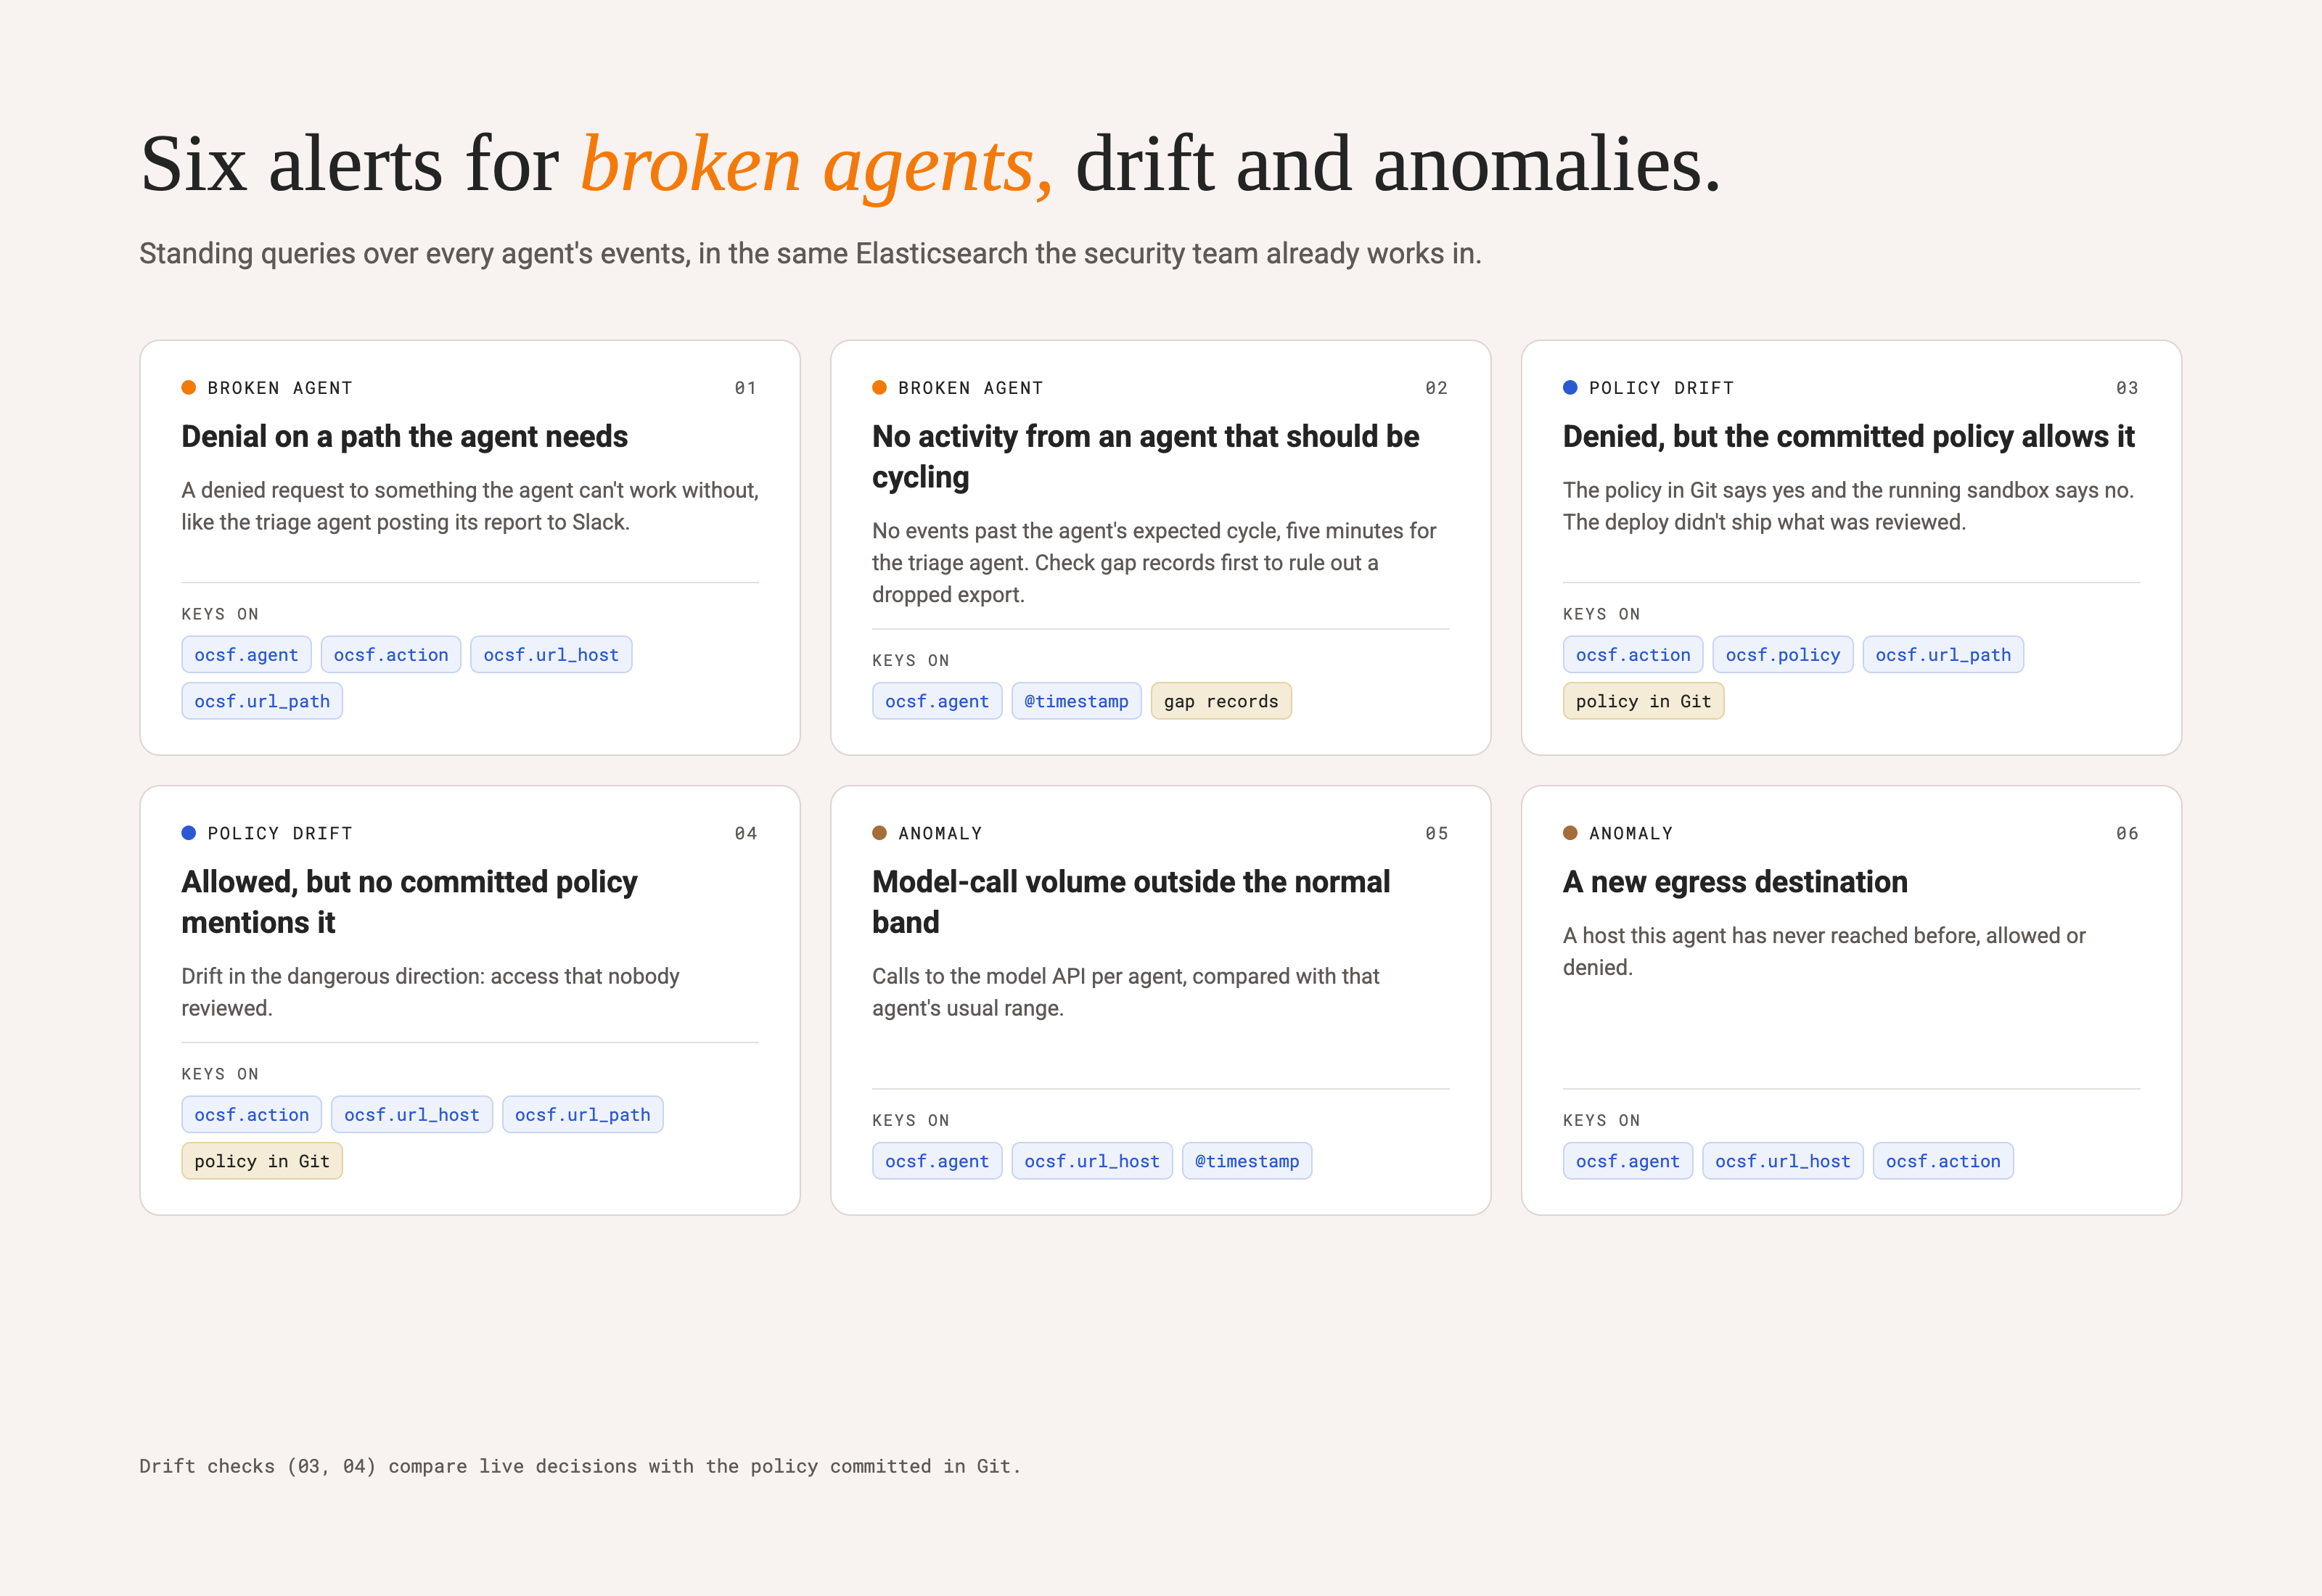
- Alert on standing queries that don't need anyone watching:
- A denial on a path the agent needs in order to function.
- No activity from an agent that should be cycling every five minutes.
- A denial on a path the committed policy allows (drift: the deploy lied).
- An allow on a path no committed policy mentions (drift in the dangerous direction).
- Model-call volume outside the normal band, or a new egress destination.
- Improve policy and prompts from observed behavior: widening deliberately, one path at a time, and removing what's never used.
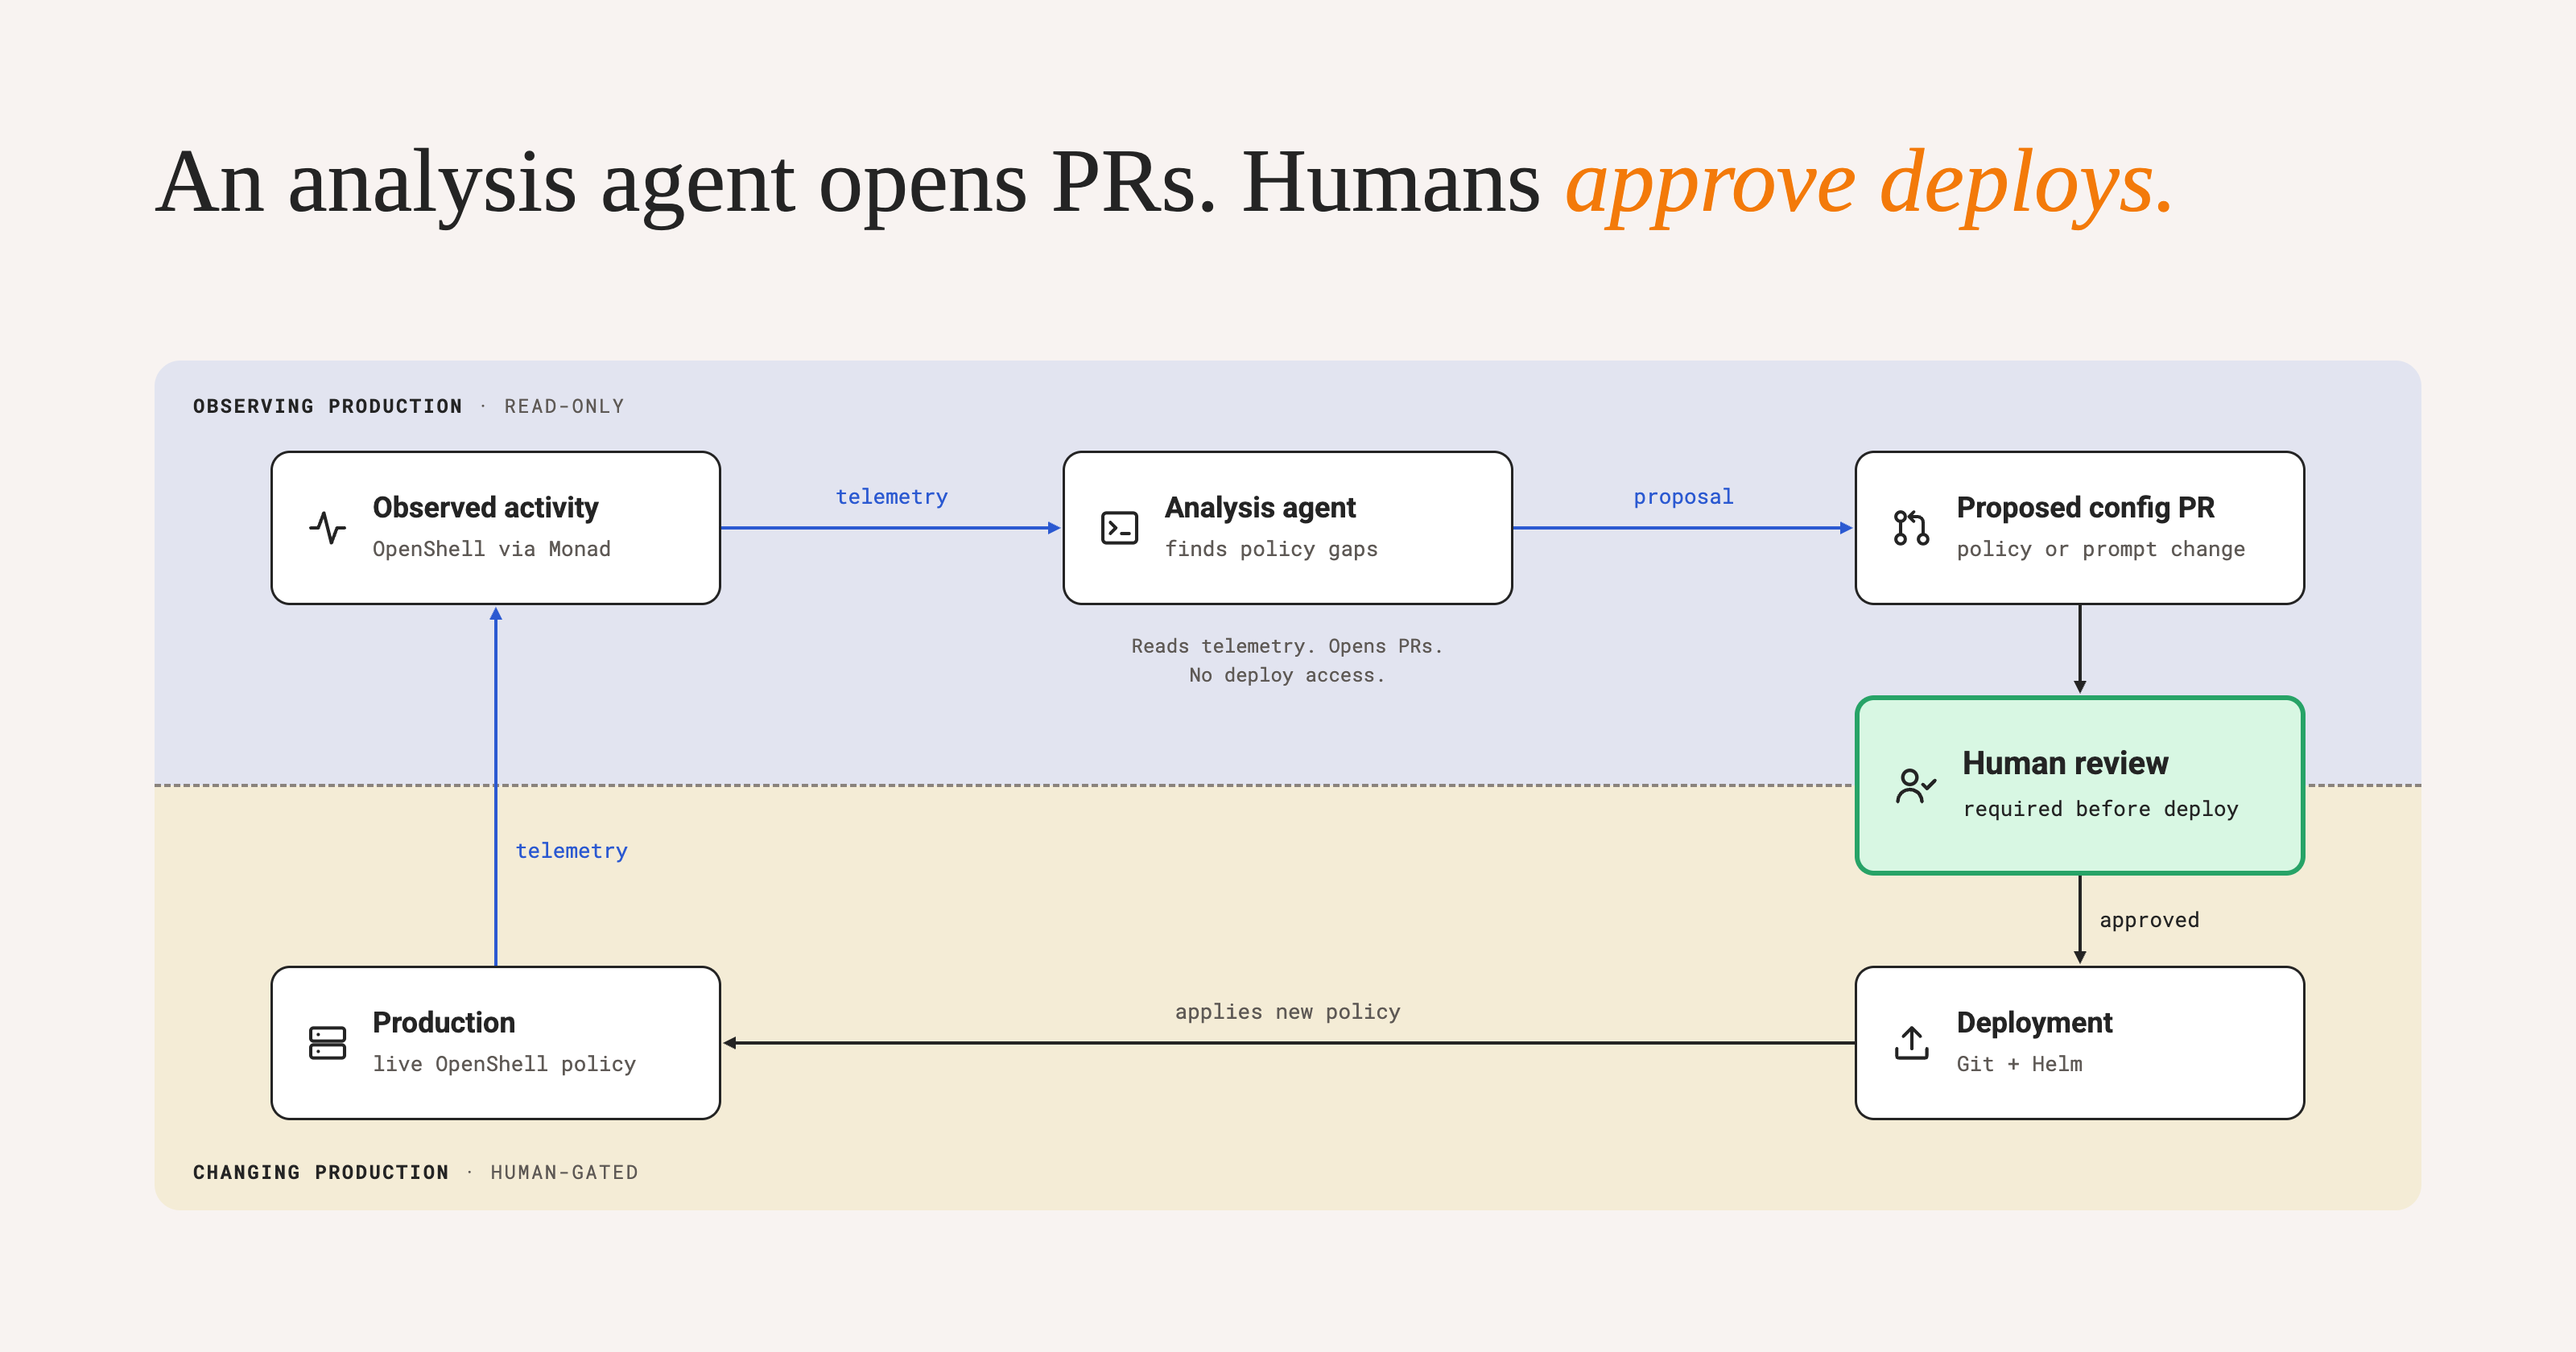
It also opens a loop we’ve begun to embrace: agents improving agents. With a full record of everything an agent has done, we are able to use a second agent to analyze the first agents logs and have it look for improvements. The monitoring agent can then submit pull requests to the configuration of the first agent to rapidly iterate and improve its abilities. All gated by a human reviewing the changes and deploying them once ready
Why Monad belongs in this loop
- Agents are a new log source. They deserve the same discipline as every other system a security team depends on: collected, normalized, enriched, and delivered to where detection and response happen.
- The pipeline is where raw data becomes useful. Shaping, enrichment, and routing happen once, centrally, instead of being rebuilt in every agent or every destination.
- It's independent of the agent. An agent that's confused, looping, or compromised is exactly the one whose self-reports you shouldn't rely on. Telemetry from the enforcement layer, processed outside the sandbox, doesn't need the agent's cooperation.
- It's decoupled. We can change destinations, add enrichment, or build new alerts without touching OpenShell or redeploying agents.
OpenShell gives us the boundary. The export and Monad make it observable. An enforced boundary you can't observe is an assertion, not a control.

Where we started, and where OpenShell has gone
When we started, getting telemetry out of OpenShell meant forking it. We built the OTLP exporter, ran it against our own agents, and proposed the approach upstream (OpenShell#2892).
Credit where it's due
The OpenShell team took that and ran with it. In a matter of weeks, exporting OCSF events became a native, opt-in part of OpenShell:
- Gateway OCSF events export as OTLP log records (OpenShell#4500).
- Sandbox supervisors export their own OCSF events the same way (OpenShell#4545).
- Supervisors export OTLP traces that join the gateway request that created the sandbox (OpenShell#3977).
- Export works against gzip and https collectors (OpenShell#4399).
- Gateway authentication and authorization decisions are now OCSF events too (OpenShell#4632, OpenShell#4728, OpenShell#4761, OpenShell#4762).
- When the export drops events, it says so with a gap record, so a quiet export can't pass for a quiet agent.
In places their design is better than ours: endpoints are set per signal, so the OCSF events can go to a SIEM while traces go somewhere else. That's a project moving quickly, in the direction people running agents in production need. Thank you to the OpenShell maintainers.
What we've added, and why
Not everything in our fork is about telemetry. Some of it is about how we deploy OpenShell at all.
Getting everything out. The enforcement events answer most of our four questions, but not all of them:
- Every log line, not only the OCSF events. The gateway's diagnostics and each sandbox's logs go out over OTLP too. They're relayed through the gateway, so sandboxes never need a network path to the collector. Delivery is accountable: queues are bounded, every drop is counted, and the next batch carries a gap record saying how much was lost and since when.
- The agent's own activity. The enforcement log tells you what an agent touched. The harness's event stream (prompts, tool calls, tool results, the final answer) tells you why. With an opt-in setting, OpenShell forwards that stream untouched, in the same feed and keyed to the same sandbox as the policy decisions. Parsing and redaction happen in the pipeline, not on the box (agent activity export).
- Auditing the control plane. Changes to sandbox templates and provider credentials emit OCSF events, so changes to the boundary itself are on the record.
Deploying declaratively. We run OpenShell the way we run everything else: from Git, through Helm, with nothing applied by hand. An agent's whole definition (its policy, prompts, credentials and harness version) has to be declared, reviewed and reproducible. That needed a few things OpenShell didn't have yet:
- Configuration from ConfigMaps. Agent prompts and settings live in Git and mount into the sandbox as Kubernetes ConfigMaps. Changing an agent is a reviewed deploy, not an image rebuild or a file copied in by hand (ConfigMap volumes).
- Credentials from Kubernetes Secrets. Providers are fed from Secrets that our secret manager keeps current, instead of being created by hand with the CLI. When a credential rotates, the agents that use it restart to pick it up (provider sync, restart on rotation).
- Pinned harness versions. Each agent image is built with a pinned version of its harness and refuses to start on a mismatch, so a harness release can't change an agent's behavior under us.
- Recovering without a person. A sandbox whose node restarts underneath it is replaced automatically (lost-runtime recovery).
Contributing back
We'd rather run upstream OpenShell than maintain a fork, and we're working with the OpenShell team to get there:
- Move onto what's shipped. We're retiring our OCSF exporter in favor of the upstream one.
- Propose the rest, the project's way. OpenShell starts features as issues and agrees on the design with maintainers before code. The audit work is already open as issues (OpenShell#2911, OpenShell#3017, OpenShell#3018). Agent activity export, ConfigMap mounts, Secret-backed providers and runtime recovery are next.
- Fix what we hit. Bugs we find along the way go upstream as fixes, like a repair to the policy prover (OpenShell#4438).
Every capability that lands upstream is one less patch we carry, and one more thing the next team running agents on OpenShell gets for free.
Four questions, one record
We started with four questions—not a goal to collect more logs. With enforcement events and agent activity exported, normalized, and available outside the sandbox, we can investigate those questions across runs instead of watching one agent at a time.

Reading the evidence:
“Is it still working?” Event volume shows activity, not necessarily successful work. Activity shows the agent is running; tool results and expected outputs help establish whether it’s completing its job. Gap records flag known export loss, but don’t rule out every telemetry failure.
“What effect did it have?” Prompts and final answers provide context, but don’t independently prove an outcome. Tool results help establish outcomes; correlate with destination-system records to verify what changed.
The value is in connecting the evidence: what the agent attempted, what its policy permitted, whether it kept running, and what its tools reported back. That gives us a basis for investigating failures and improving the next run, not just an archive of the last one.
What's next
- Emit the enforced policy version on every decision event, so drift is detectable with a query.
- Baselines for each class of agent: expected hosts, call volume, and cycle shape.
- Bring the policy itself into the pipeline as data, so we can find permissions that are granted but never used.
If you're running agents on OpenShell and want the same visibility, explore our fork or talk to us about getting agent telemetry into the security tools you already use.
Related content
Darwin Salazar
|
October 22, 2026