June 2, 2026
Detection Engineering for OpenAI Codex: What to Alert On from the OTel Stream
.png)
.jpeg)
Darwin Salazar
Head of Growth
Codex can export OpenTelemetry, but the implementation details are still evolving. Today, Codex separates logs, traces, and metrics into distinct exporter settings, and OTLP/HTTP paths should be validated against your collector.
The goal of this post is to identify Codex telemetry signals that may indicate risky configuration, suspicious automation, anomalous tool use, or data exposure.
The detection patterns below are meant to be validated against your own Codex export and pipeline before alerting. Exact field paths will depend on how your collector, pipeline, SIEM, or lakehouse stores OTLP attributes and resource attributes.
Part 2 will cover the hands-on setup: configuring Codex export, routing it through Monad, validating raw events, normalizing fields, applying redaction and retention, and sending the right data to your SIEM, data lake, or archive.
🔎 This post is part of Monad’s broader effort to document telemetry from widely used AI developer and enterprise tools. It builds on our detection engineering work for OpenAI Enterprise audit logs and Claude Code telemetry, with the same goal: help security teams understand what these tools emit, which signals are useful, and where detections need validation against real data.
The Detection Case for Codex
AI coding agents increasingly act on the developer environment, not just inside a chat box. OpenAI’s Codex agent approvals and security docs describe local Codex as able to read files, make edits, and run commands in the working directory automatically in the workspace-write preset, while asking for approval when it needs to leave the workspace or use the network.
That makes Codex an operationally sensitive process, especially on developer laptops, CI runners, and dev containers.
Runtime research is starting to emerge. Sysdig’s runtime security research for AI coding agents is useful here. Huntress has also published a two-part write-up on Codex activity that complicated SOC triage during an incident response workflow: part one and part two.
This post focuses on a narrower question:
What should defenders alert on inside Codex’s own telemetry stream?
The goal is not to replace endpoint telemetry or network visibility. It is to focus on five Codex-native signals that are concrete enough to validate against your own data: policy settings, prompt logging behavior, tool approval decisions, network-enabled sessions, and new emitters.
This is for teams running local Codex surfaces: CLI, IDE extension, desktop app, or automation runners. Codex cloud and Codex Security have different telemetry models and should be handled separately.
What Codex emits
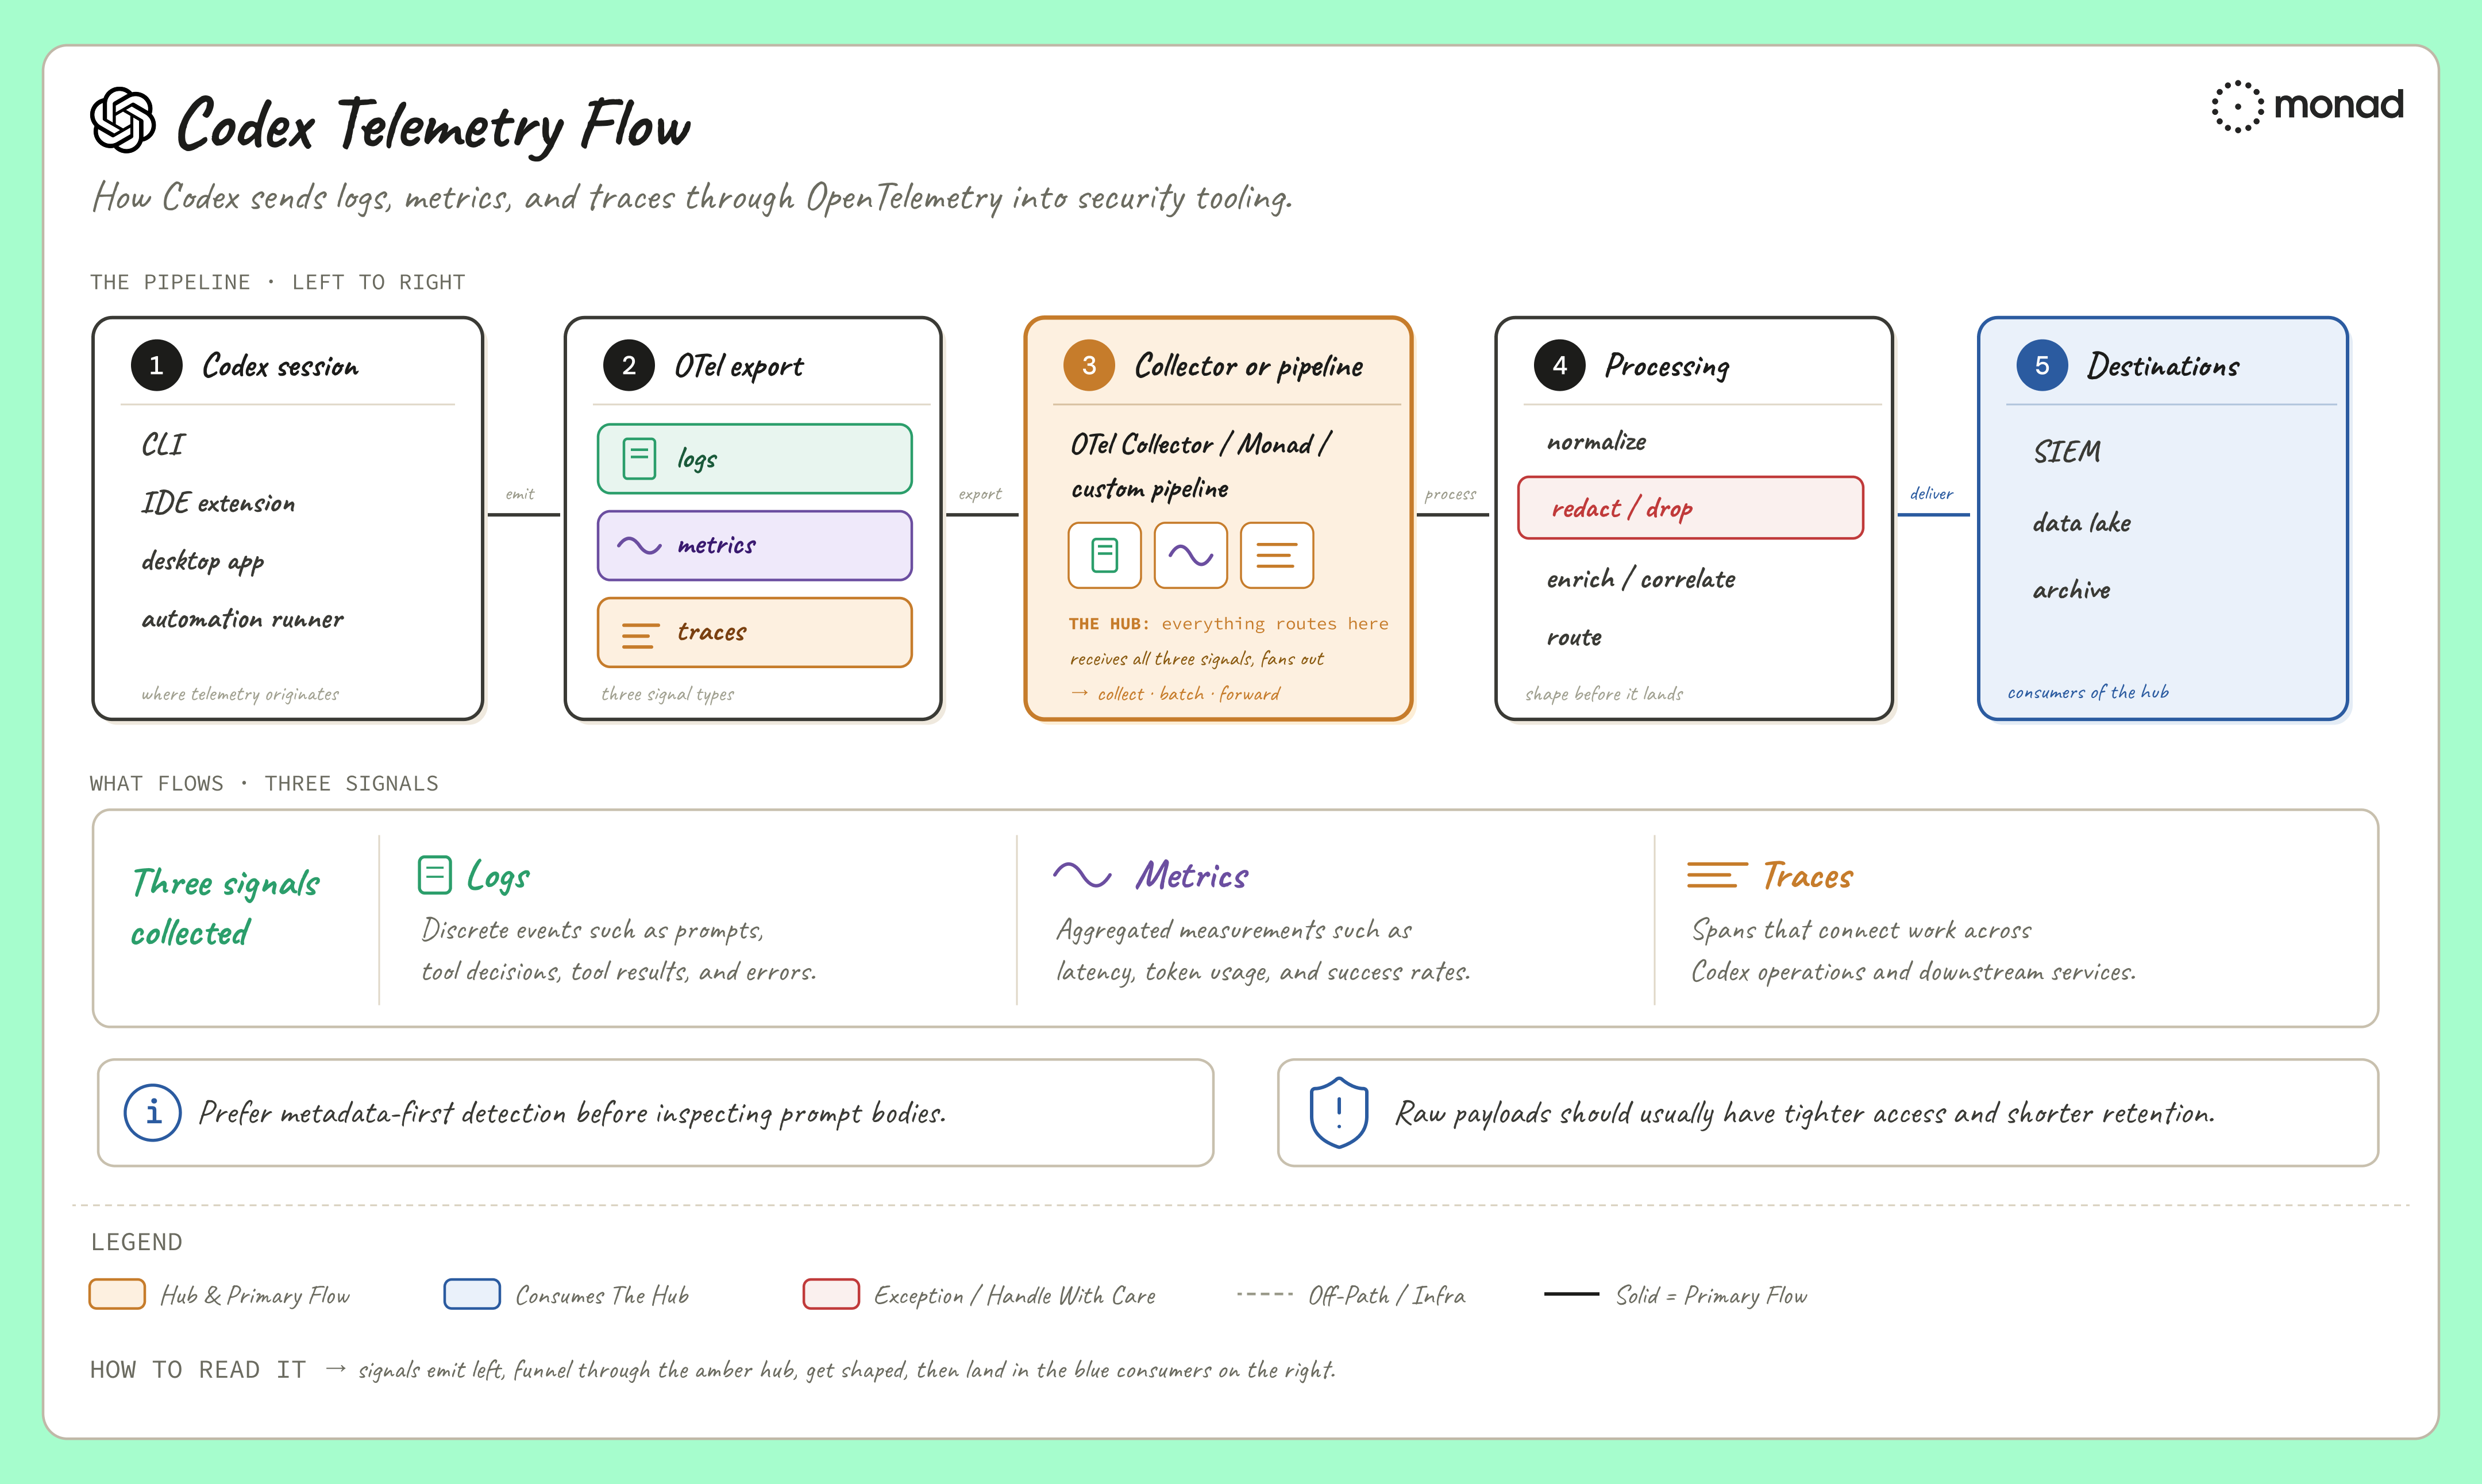
OpenAI documents the following as representative Codex OTel events:
codex.conversation_starts, session start, model, approval policy, sandbox policy, and related contextcodex.api_request, OpenAI API/model transport activity, status, duration, attempts, and errorscodex.sse_event, streaming activity, event kind, success/failure, duration, and token counts on completioncodex.websocket_requestandcodex.websocket_event, WebSocket activity for real-time flowscodex.user_prompt, prompt length, with content redacted unlessotel.log_user_promptis enabledcodex.tool_decision, approval decisions and whether the source was user, config, or automationcodex.tool_result, tool execution results, duration, success, arguments, and output
Treat that list as representative, not exhaustive. Codex may emit additional events depending on version and surface.
A few details matter for detection engineering.
First, logs, traces, and metrics do not carry identical fields. For detection work, start with logs because they carry the richest per-event context. Metrics are still useful for baselining, dashboards, and a few important dimensions such as tool-call decisions, but they should not be treated as the primary per-conversation detection source.
Here is a representative raw Codex OTel log event from a real sample. It keeps the OTLP nesting under resourceLogs, scopeLogs, and logRecords so the structure is visible. The sample is lightly cleaned for readability: dotted OTel keys are shown as plain strings instead of linkified markdown, and host, user, conversation, trace, and span values use clear fictional examples. Prompt content remains redacted.
{
  "resource": {
    "attributes": {
      "service.name": "codex-app-server",
      "service.version": "0.119.0-alpha.28",
      "host.name": "dev-laptop-042"
    }
  },
  "logRecord": {
    "attributes": {
      "event.name": "codex.user_prompt",
      "prompt_length": "147",
      "prompt": "[REDACTED]",
      "conversation.id": "conv_7f3a91c2b8e44d9a",
      "app.version": "0.119.0-alpha.28",
      "originator": "Codex_Desktop",
      "user.email": "developer@acme.example",
      "model": "gpt-5.2-codex"
    }
  }
}
{
"resourceLogs": [
{
"resource": {
"attributes": [
{ "key": "telemetry.sdk.name", "value": { "stringValue": "opentelemetry" } },
{ "key": "service.name", "value": { "stringValue": "codex-app-server" } },
{ "key": "telemetry.sdk.version", "value": { "stringValue": "0.31.0" } },
{ "key": "env", "value": { "stringValue": "prod" } },
{ "key": "service.version", "value": { "stringValue": "0.119.0-alpha.28" } },
{ "key": "host.name", "value": { "stringValue": "dev-laptop-042.acme.example" } },
{ "key": "telemetry.sdk.language", "value": { "stringValue": "rust" } }
],
"droppedAttributesCount": 0,
"entityRefs": []
},
"scopeLogs": [
{
"scope": {
"name": "codex_otel.log_only",
"version": "",
"attributes": [],
"droppedAttributesCount": 0
},
"logRecords": [
{
"timeUnixNano": "0",
"observedTimeUnixNano": "1779818335239262000",
"severityNumber": 9,
"severityText": "INFO",
"body": null,
"attributes": [
{ "key": "event.name", "value": { "stringValue": "codex.user_prompt" } },
{ "key": "prompt_length", "value": { "stringValue": "5" } },
{ "key": "prompt", "value": { "stringValue": "[REDACTED]" } },
{
"key": "event.timestamp",
"value": { "stringValue": "2026-05-26T17:58:55.239Z" }
},
{ "key": "conversation.id", "value": { "stringValue": "conv_7f3a91c2b8e44d9a" } },
{ "key": "app.version", "value": { "stringValue": "0.119.0-alpha.28" } },
{ "key": "auth_mode", "value": { "stringValue": "Chatgpt" } },
{ "key": "originator", "value": { "stringValue": "Codex_Desktop" } },
{ "key": "user.account_id", "value": { "stringValue": "acct_9b2c4f81a7d34e10" } },
{ "key": "user.email", "value": { "stringValue": "developer@acme.example" } },
{ "key": "terminal.type", "value": { "stringValue": "unknown" } },
{ "key": "model", "value": { "stringValue": "gpt-5.2-codex" } },
{ "key": "slug", "value": { "stringValue": "gpt-5.2-codex" } }
],
"droppedAttributesCount": 0,
"flags": 1,
"traceId": "4f8c2f5e9d7a4b6c91e3f0a2b8d6c123",
"spanId": "8b7e2f4c91a0d653",
"eventName": "event otel/src/events/session_telemetry.rs:848"
}
],
"schemaUrl": ""
}
],
"schemaUrl": ""
}
]
}The important detail is the shape. In raw OTel logs, fields such as event.name, conversation.id, originator, user.email, and prompt appear as log attributes. Fields such as service.name, service.version, and host.name appear as resource attributes.
Most detections will run against a flattened or normalized version of this payload. That is why the patterns below reference both raw OTel-style names and common normalized names like event_name, conversation_id, and service_name.
This example is intentionally log-specific and simplified for readability. Codex metrics and traces can carry different fields, and the full OTLP export shape will include additional nesting, timestamps, counters, trace/span identifiers, and wrapper fields.
In this example, the prompt body is redacted but prompt_length is still available. That redaction choice is a tradeoff, not a universal rule.
Prompt content may contain sensitive code, vulnerability details, internal system context, or user-specific information that you may not want broadly visible to everyone with SOC log access. At the same time, prompt visibility can provide huge detection and insider-threat value when it is intentionally scoped, access-controlled, and retained appropriately.
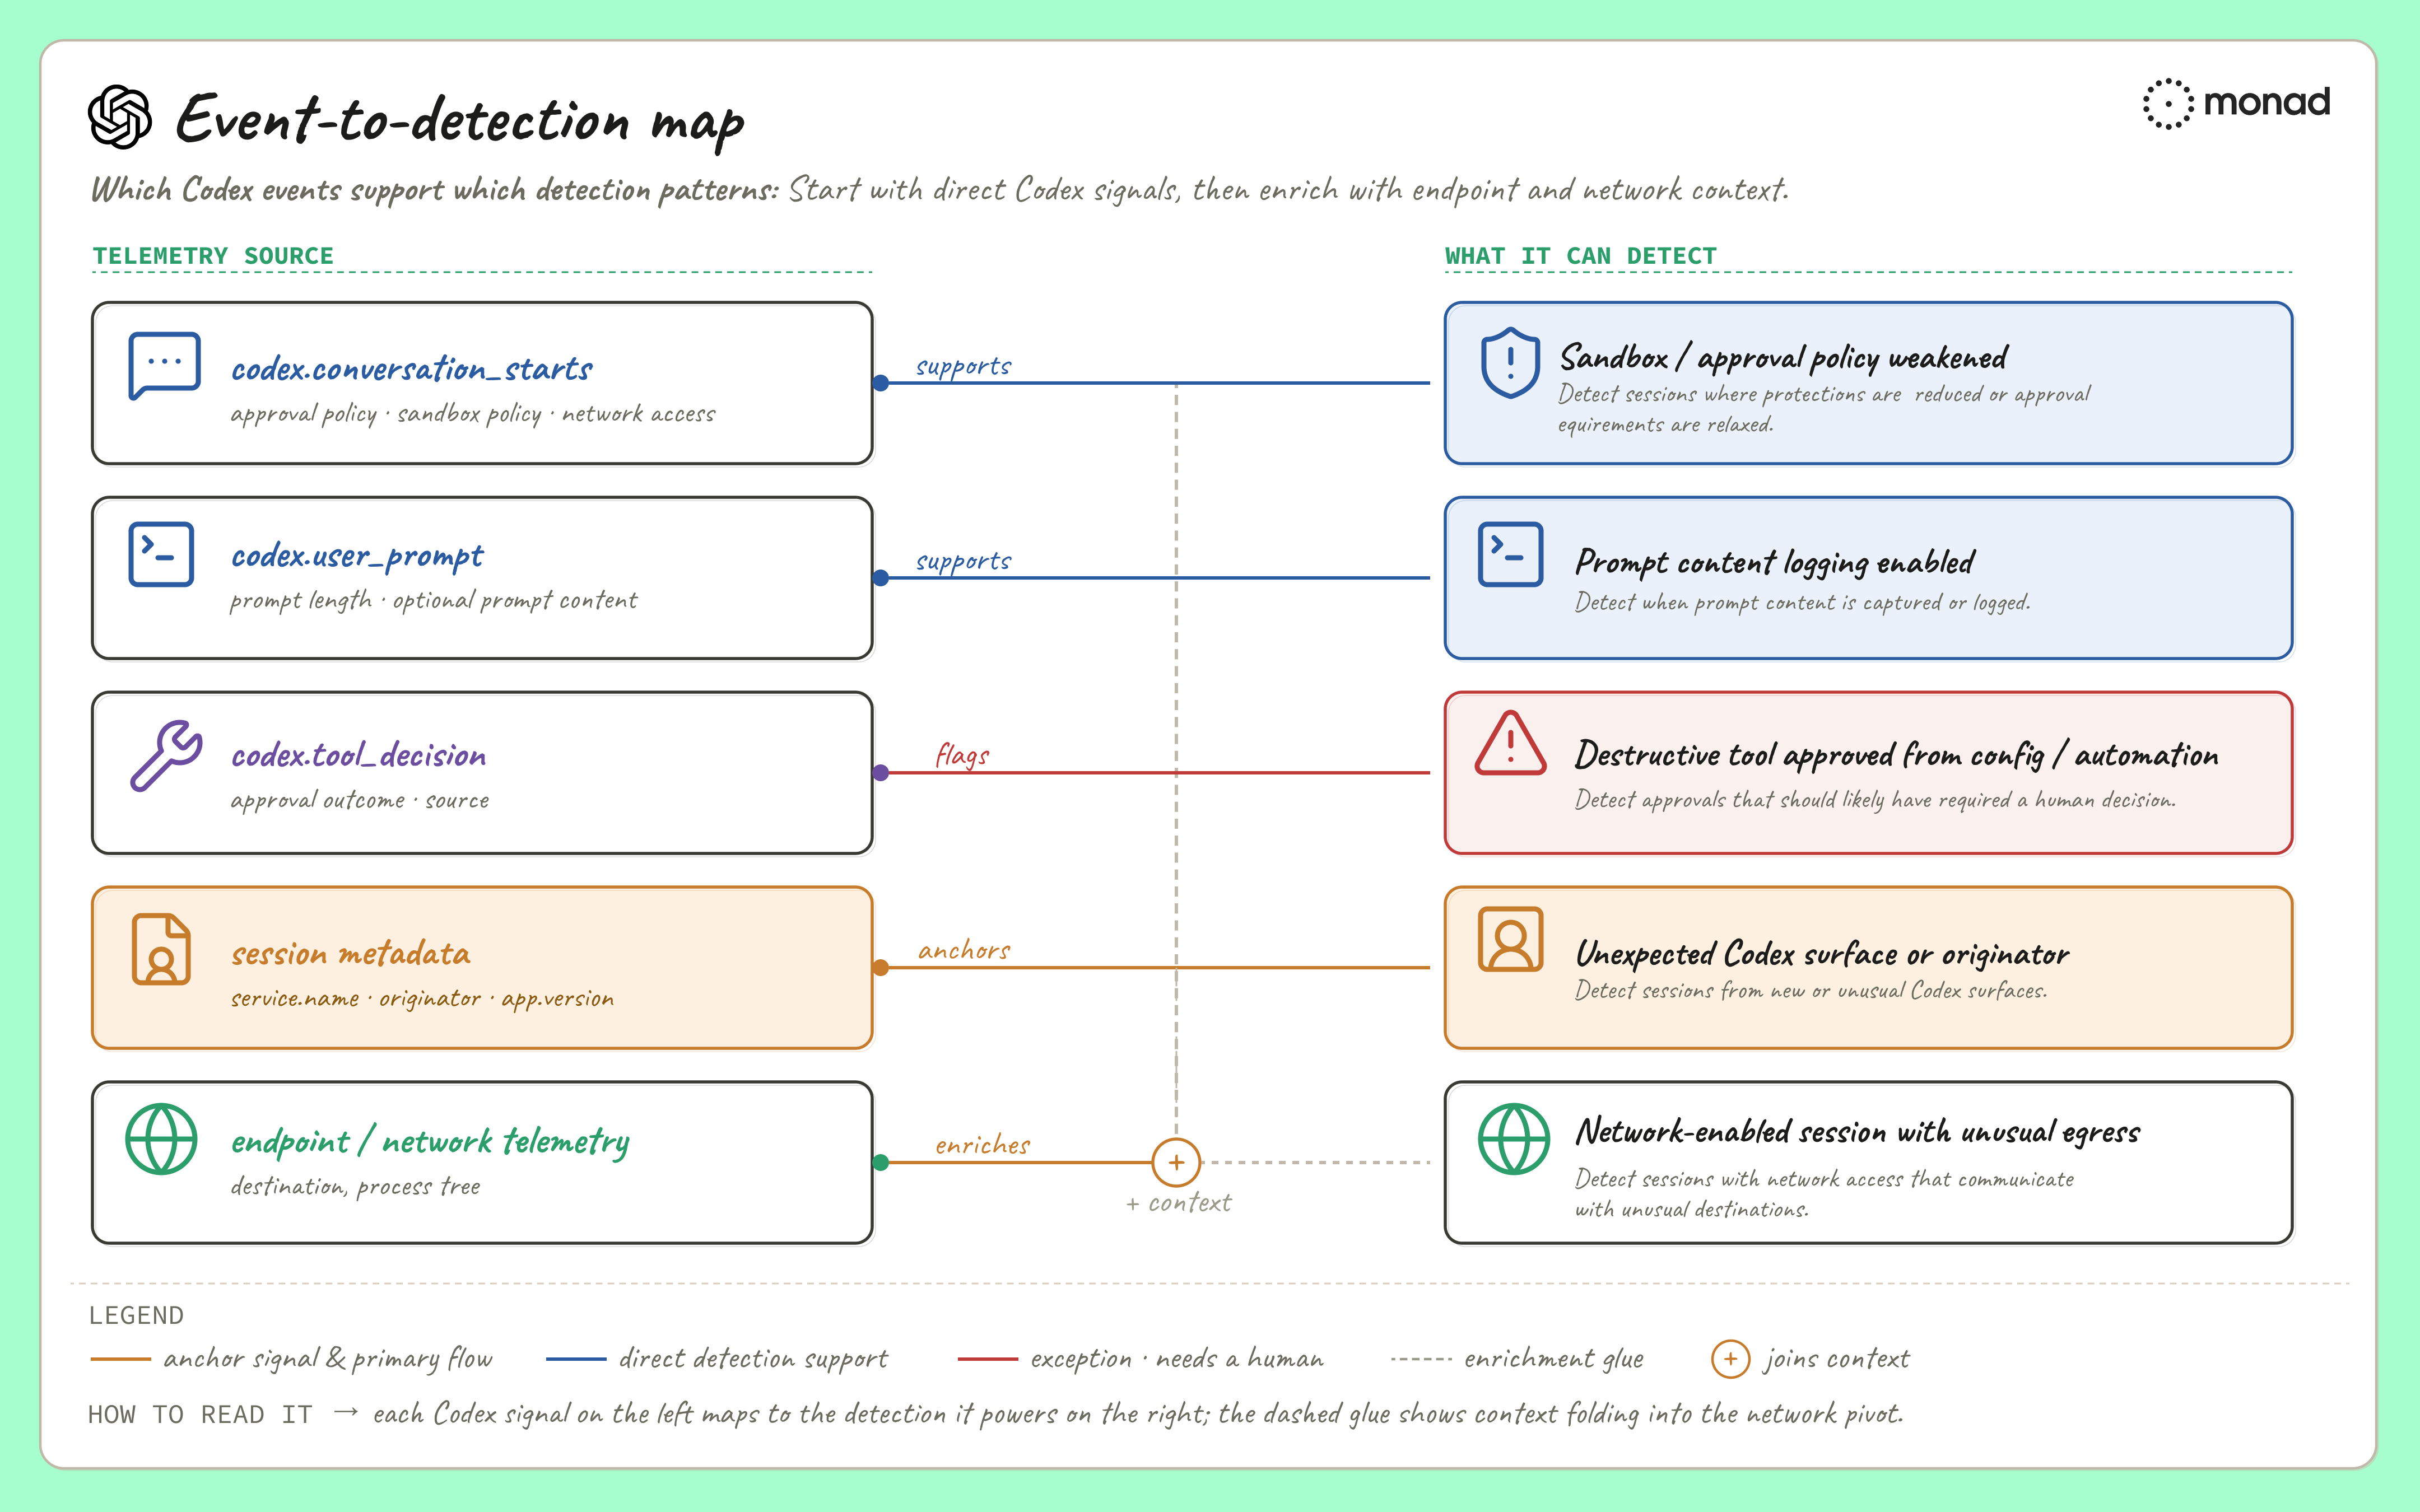
Second, current codex.conversation_starts telemetry emits approval_policy and sandbox_policy, not a flat sandbox_mode field. If your pipeline normalizes this to sandbox_mode, that is a downstream convenience field, not the canonical raw event name.
Third, treat codex.tool_result as sensitive. Depending on version and collector output, it may include shell output, patch bodies, tool arguments, or file content, not just metadata.
Use the OpenAI Codex advanced configuration docs, the Codex configuration reference, and your own raw events as the implementation reference.
Threat Model: Codex Misuse, Drift, and Exposure
Codex is security-relevant because it operates inside developer environments. Depending on configuration and surface, it may read code, execute commands, edit files, invoke tools, and use network access from systems that already have access to source code, credentials, tickets, build systems, or production context.
This creates three practical risk categories:
- Misuse: Codex activity is initiated by a compromised account, unauthorized user, or unsafe automation and blends into normal developer workflows.
- Drift: A session runs with sandbox, approval, network, or tool-control settings that differ from the organization’s expected posture.
- Exposure: Prompt content, tool results, shell output, patches, file paths, credentials, or sensitive source context are exported into telemetry streams without the same access controls or retention rules as the source systems.
Those risks turn into concrete detection questions:
- Did a Codex session start with weaker-than-expected sandbox or approval settings?
- Did prompt content, tool output, or other sensitive material appear in exported telemetry?
- Were destructive tools approved by config or automation instead of a human decision?
- Did a network-enabled session correlate with unusual egress or unexpected process behavior?
- Did a new Codex originator, service, version, or session source appear outside known rollout paths?
The next section turns those scenarios into detection patterns that security teams can validate against their own Codex telemetry.
Detection patterns
Start with checks that are easy to validate against raw events and expected configuration: weakened sandbox policy, prompt content logging, sensitive tool result export, and unexpected originators. Treat network egress correlation as a later-stage detection because it requires more enrichment, allow-listing, and process context.
Codex OTel provides the starting signal for each pattern below, but not every pattern is complete with Codex telemetry alone. Sandbox policy, prompt logging, and new Codex surfaces are mostly Codex-native. CLI bypass flags, destructive-tool classification, and unusual egress require enrichment from endpoint, tool metadata, or network telemetry.
The patterns below lead with the risk, then cover detection logic, fields to validate, tuning notes, and recommended enrichment. The goal is to make each idea portable without pretending the same SQL, schema, or field names will work in every environment.
1. Sandbox policy weakened
Risk / threat: A weakened sandbox or approval policy can turn Codex from a constrained developer assistant into a process with broader ability to modify files, execute commands, or act without human review. In a compromised account, unsafe automation, or misconfigured CI runner, that can expand the blast radius quickly.
Detection logic: Review codex.conversation_starts events where the session starts with danger-full-access, approval policy is set to never, or equivalent weakened controls are present. Validate CLI bypass flags such as --dangerously-bypass-approvals-and-sandbox or --yolo in endpoint telemetry rather than assuming they appear in Codex OTel.
Key detection fields: event.name, approval_policy, sandbox_policy, originator, service.name, user.email, host.name
Tuning notes: Approved CI, automation runners, lab environments, and power-user workflows may generate expected hits.
Recommended enrichment: Endpoint or process telemetry for CLI flags and process context.
2. Prompt content logging enabled
Risk / threat: Prompt bodies can contain source code, vulnerability details, incident context, internal hostnames, credentials, or customer-sensitive information. If prompt content is exported broadly, the telemetry pipeline can become a second location where sensitive developer context is stored, searched, and retained.
Detection logic: Review codex.user_prompt events where the prompt field is populated with something other than [REDACTED], or where your collector’s normalized fields indicate unredacted prompt content.
Key detection fields: event.name, prompt, prompt_length, conversation.id, originator, user.email
Tuning notes: Some teams may intentionally enable prompt logging in development, testing, or tightly scoped troubleshooting workflows.
3. Destructive tool approval from config or automation
Risk / threat: State-changing tools are where agent decisions become real changes: deleting files, modifying infrastructure, updating repositories, or mutating external systems. If those actions are approved by config or automation instead of a human decision, a bad prompt, unsafe workflow, or compromised session may have fewer checks before impact.
Detection logic: Review codex.tool_decision events where decision = approved, the approval source is configuration- or automation-derived, and the tool is known to modify state.
Key detection fields: event.name, tool_name, call_id, decision, source, conversation.id, originator
Tuning notes: This pattern depends on your definition of state-changing or destructive tools. Treat the registry or enrichment source as part of the detection, not an implementation detail.
Recommended enrichment: MCP metadata, app tool metadata, or an internal tool registry that identifies tools capable of deleting files, changing infrastructure, updating repositories, or mutating external systems.
4. Network-enabled session with unusual egress
Risk / threat: Network access can turn a local agent session into a possible path for data movement, dependency tampering, or interaction with unexpected external services. On its own, Codex telemetry can show whether network was allowed; paired with endpoint and network telemetry, it can help identify unusual destinations or process behavior around that session.
Detection logic: Review Codex sessions where network access is enabled and endpoint, DNS, proxy, firewall, netflow, or eBPF telemetry shows destinations outside the expected allow-list.
Key detection fields: event.name, sandbox_policy, approval_policy, conversation.id, originator, user.email, host.name
Tuning notes: Network behavior is highly environment-specific. Package managers, source control, artifact repositories, and approved SaaS services can create expected egress.
Recommended enrichment: Network telemetry, host identity, user identity, process lineage, time-window correlation, and approved egress destinations.
5. Unexpected Codex originator or service surface
Risk / threat: New originators, service names, app versions, or session sources can indicate Codex is running somewhere security teams did not expect: a new rollout, unmanaged workstation, automation runner, misconfigured collector, or shadow workflow. That makes inventory drift an early signal for where detection assumptions may no longer hold.
Detection logic: Review new originator values in logs, new service.name resource values, and new session_source values in metrics.
Key detection fields: originator, service.name, service.version, app.version, session_source, host.name, user.email
Tuning notes: New values may reflect legitimate rollout, version upgrades, collector changes, or new automation paths.
Recommended enrichment: Known-good inventory for Codex surfaces, expected services, approved CI runners, and managed developer environments.
Baseline before alerting
Collect data before enforcing rules broadly.
Expected patterns vary by organization, but four baselines are useful:
- Human versus CI or automation sessions
- Expected approval sources and sandbox policies
- Known originators, service names, app versions, and session sources
- Normal event volume by session, surface, and workflow
Metrics are useful for baselining, but do not assume they can always be joined back to conversation.id.
Start with the detections that are usually easiest to validate:
- Sandbox or approval policy weakened
- Prompt content exported
- Destructive tool approval from config or automation
- New originator or service surface
- Network-enabled sessions with unusual egress
Privacy, redaction, and retention
Prompt bodies and tool results deserve review before being treated like ordinary application logs.
Prompt content can include source code, stack traces, incident notes, internal hostnames, vulnerability details, customer context, and secrets. Tool results can include shell output, patch bodies, command arguments, file paths, and file content.
That can make the telemetry stream as sensitive as the original agent session, depending on what is exported and where it is routed.
A few implementation principles matter regardless of pipeline:
- Prefer metadata-first detection before inspecting prompt bodies.
- Redact or mask sensitive prompt content, tool output, shell output, patches, tokens, keys, and other secrets before broad SIEM access.
- Consider separate access controls and shorter retention for raw payloads than for normalized detection fields.
- Keep allow-lists for service names, originators, CI runners, and approved egress destinations under change control.
- Validate telemetry behavior on the exact Codex surface you use: CLI, IDE extension, desktop app, automation runner, or CI.
Out of scope
A few related topics deserve separate treatment:
- Prompt-injection detection: useful, but it usually requires inspecting prompt content, tool output, repository content, or running a sidecar inspector.
- **Codex Security and Codex cloud activity:** different integration models from local Codex OTel.
- Cross-agent correlation: most orgs run more than one agent. Claude Code to Codex pivots require unified instrumentation across providers.
- Endpoint-only detection: CLI flags, process lineage, shell history, and child-process behavior should be covered in EDR or endpoint telemetry, not Codex OTel alone.
Closing
These detections should be treated as starting points for validation, not portable rules. There are more Codex detections worth writing, including anomaly-based rules for tool-call rate, duration, repeated failures, command fan-out, and sensitive file access.
The set above is intentionally focused on checks that are concrete, reviewable, and relatively easy to validate:
- Weakened sandbox or approval policy.
- Unredacted prompt export.
- Destructive tool approval from config or automation.
- Network-enabled sessions with unusual egress.
- Inventory drift in where Codex is running.
Test them against your own data, validate field names against raw events, and update exporter configuration as OpenAI’s implementation evolves.
Part 2 will cover ingesting Codex telemetry with Monad, validating that expected events are arriving, normalizing the stream, applying redaction and retention decisions, and routing events to your SIEM, data lake, or archive.
If you are working on Codex telemetry or need help routing it into your security stack, email us at product@monad.com. We are actively working through integration edge cases like the ones described in this post.
Related content
.png)
Darwin Salazar
|
July 16, 2026
.png)