May 19, 2026
How Much is Bad Data Actually Costing Your Security Team?

.jpeg)
Darwin Salazar
Head of Growth

Valerie Zargarpur
Head of Marketing
TL;DR:
- “Bad data” isn’t useless data. In security, “bad” depends on the objective, environment, and destination.
- The cost usually shows up in three places: expensive retention for data in the wrong tier, analyst time spent manually gathering context, and detections that are harder to write because the data is not normalized.
- These costs get worse during SIEM migrations, especially when teams parallel-run two platforms and duplicate ingest.
- The fix is not to drop more data. It is to classify, filter, enrich, normalize, and route data before it reaches downstream tools, with enough visibility to test and reverse those decisions.
Every security leader has lived through some version of this conversation. Renewal lands and ingest costs are up. Someone in finance asks what the team is actually getting for the spend, and the honest answer is hard to prove because most teams do not have clean visibility into what data is flowing where, what it costs by source, or how much of it is actually being used.
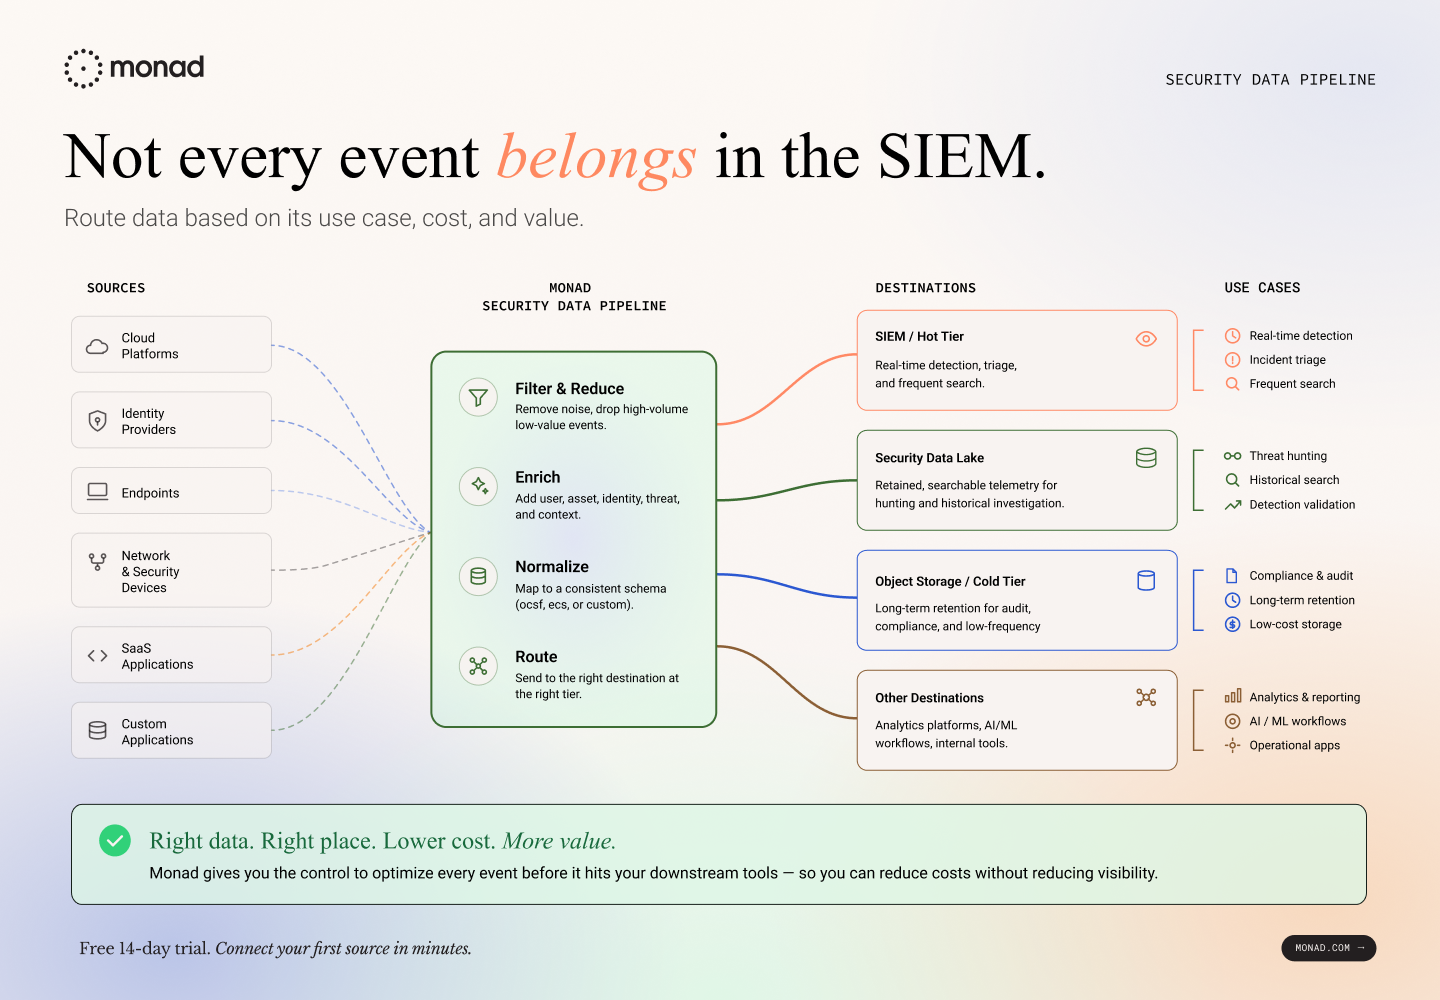
That problem is only getting more difficult as enterprises adopt AI agents. Agents create more machine-driven activity: more API calls, more tool usage, more identity events, more application logs, and more audit trails. Each of those events may be useful somewhere, but not every event belongs in the SIEM’s hottest and most expensive tier.
The SIEM bill gets the attention, but the bill is a lagging indicator. By the time it arrives, the data has already been stored, the cost is locked in, and the pipeline configurations that drove it may be months old.
The question is not just “why is our SIEM so expensive?” It is: “which data is worth keeping hot, which data belongs in cheaper storage, and which data needs more context or normalization before it can be useful?”
Most teams have never tried to answer that question systematically. Here’s a framework for getting close.
First: what counts as "bad data"?
Bad data isn’t data that is useless. In security, “bad” depends on your objectives, your environment, and where the data is going. Bad data is data that costs more than the security value it delivers in its current destination.
A log that is low-value for real-time detection may still matter for threat hunting, compliance retention, or incident reconstruction. The same event can be wasteful in one destination and valuable in another.
For this post, “bad data” means security data that creates more cost, friction, or detection risk than value in its current form, schema, or destination.
That usually means data that is:
- Misplaced: stored in an expensive SIEM tier when cheaper retention would work
- Under-contextualized: missing user, asset, or threat context analysts need to triage
- Unnormalized: difficult to correlate across sources because fields and schemas do not align
- Operationally noisy: technically valid, but high-volume enough to bury the signals your team actually acts on
The hardest part is classification. You need to know what supports detection, what supports compliance, what supports investigations, and what your team can safely transform or route elsewhere.
With that framing, the cost of bad data breaks into three layers.
Layer 1: Storage and ingest waste
SIEMs are still where many teams search, correlate, alert, and investigate. They are valuable systems. They are also expensive places to put data by default.
That matters because security telemetry keeps growing: identity events, endpoint activity, cloud audit logs, SaaS logs, network data, and now AI agent activity. If every source flows into the same hot, searchable SIEM tier, teams end up paying premium prices for data that may only need retention, occasional search, or downstream analytics.
The issue is not that this data has no value. The issue is that not all value requires the same destination.
A mature data strategy should help teams decide:
- What needs to be searchable in the SIEM now
- What should be retained cheaply for audit, forensics, or historical search
- What should be enriched or normalized before it lands downstream
- What should be routed to multiple destinations, and why
- What can be filtered only after the team can test, observe, and recover the original
Without that control, most teams default to sending too much data to the most expensive tier. Health checks, heartbeats, informational events, debug logs, and high-volume SaaS activity may all be useful somewhere, but not all of it needs to be indexed in the SIEM for real-time detection.
For retained data that still needs to be searchable, a security data lake can be a better fit. Products like Scanner give teams a way to keep broader telemetry in lower-cost object storage while still supporting historical search, threat hunting, and detections over longer retention windows. Monad can sit upstream of that pattern, helping teams filter, enrich, normalize, and route telemetry to the SIEM, Scanner, or both based on how each stream is actually used.
The point is not to choose between visibility and cost control. It is to keep high-value data hot where it needs to be hot, while making the rest retained, searchable, and useful somewhere better suited to the workflow.
How to estimate this for your own environment
The math is straightforward once you have the inputs. For any single log source:
- Measure daily raw volume for that source.
Start with GB/day by source. Most SIEMs expose this through ingest, usage, or billing dashboards. - Identify your effective per-GB cost.
Published rates can help with rough estimates, but your actual contracted rate is what matters. Use the rate your team pays after commitment tiers, discounts, storage options, and retention settings. - Estimate what percentage of that source needs hot SIEM storage.
This is the judgment call. Do not ask, “is this data security-relevant?” Ask, “does this data need to be indexed and searchable in the SIEM at this cost and retention period?”
For example, an identity provider may generate security-critical events, routine login events, MFA events, system events, and health checks. Some may need real-time detection. Some may only need cheaper retention. Some may need enrichment or normalization before they are useful. The split depends on your detection library, investigation workflows, compliance requirements, and risk tolerance. - Multiply.
Raw volume × effective per-GB cost × retention period = current cost.Hot-tier volume × effective per-GB cost × retention period = estimated optimized cost.
The point is not to prove that half your data is worthless. It is to identify which data needs premium SIEM treatment and which data can be handled differently without losing visibility.
Example: Okta System Log events
Hypothetical, round numbers
These numbers are illustrative. Okta System Log volume depends on tenant size, enabled products, event mix, API activity, authentication patterns, and downstream retention requirements. Your effective SIEM cost depends on vendor, region, commitment tier, discounts, retention settings, and whether reducing volume changes your committed tier or only reduces overage. The 50% hot-tier reduction is an assumption, not a benchmark. Run this against your own data.
Multiply that across 20 or 30 sources and the numbers compound quickly. The problem is that most teams can see total ingest volume, but not the more important split: what needs hot SIEM storage, what belongs in cheaper retention, and what needs enrichment or normalization before it lands downstream.
A note on filtering risk: Reducing SIEM ingest can create blind spots if teams drop or transform data without visibility, testing, and rollback. The goal is not to filter aggressively. It is to filter deliberately.
A safer pattern is to retain a copy of the original event in cheaper storage, test filtering logic against real traffic, and monitor what is being removed over time. Cost savings only matter if the team can still recover the data needed for investigations, audits, and detection coverage.
Layer 2: Analyst time spent gathering context
The second cost layer doesn't appear on an invoice, but it shows up in headcount pressure, burnout, and slow mean-time-to-respond.
When a detection fires, the event(s) that triggered it almost never contains enough context to triage. The analyst has to go find that context manually, pulling tabs across three or four tools, running queries, checking HR systems. What they're looking for:
- IP geo and threat intel
- User department, employment status, access history
- Asset owner, sensitivity classification, compliance scope
What that manual work looks like
The time cost varies by alert type. A failed login from a known-bad IP might take seconds to dismiss. A potential supply chain compromise might take hours. But in many cases, the first step is the same: the analyst has to gather context the alert did not include.
That usually means looking up:
- Whether the user is still employed, privileged, or behaving normally
- Whether the asset is owned, sensitive, exposed, or in scope for compliance
- Whether the IP, domain, or hash has known threat intelligence
- Whether similar activity has appeared across identity, endpoint, cloud, or SaaS logs
SOAR platforms and AI SOC tools can help automate parts of this workflow, but they are not magic. They still require deployment, integrations, playbook design, tuning, maintenance, and high-quality data underneath. If the source event is missing context or uses inconsistent fields, automation just moves the lookup problem somewhere else.
This is where poor data quality turns into analyst time. If every alert requires a human, playbook, or AI agent to pivot across three or four tools before making a triage decision, the bottleneck is not only staffing. It is context.
Upstream enrichment does not replace analyst judgment, and it will not make complex investigations simple. But it can remove a lot of repetitive lookup work from routine triage. When events arrive with user, asset, and threat context already attached, analysts can spend more time deciding what happened and less time assembling the facts.
Layer 3: Detections you can’t write
The third cost is harder to measure because it shows up as coverage you do not have yet: rules that never get written, correlations that never work reliably, and response workflows that depend on manual context gathering.
A few common examples:
- Correlation that breaks across sources. CloudTrail, Okta, endpoint, and SaaS logs may all describe users, IPs, devices, and actions differently. If fields are named differently, nested differently, or populated inconsistently, a simple idea like “same user or IP showing suspicious activity across multiple systems” becomes harder to express and harder to trust.
- Rules that depend on missing context. You may want to detect a privileged account logging in from a new country, accessing a sensitive asset, or using an unusual device. But if geo, user role, asset criticality, or device ownership is not available at detection time, the rule either becomes noisy, incomplete, or impossible to write cleanly.
- Response timelines that outpace manual triage. CrowdStrike’s 2026 Global Threat Report found that average eCrime breakout time fell to 29 minutes in 2025, with the fastest observed breakout at 27 seconds. If analysts need 30 minutes just to collect context across tools, containment may already be late.
This compounds over time. Every month that data remains inconsistent, under-contextualized, or hard to correlate, detection coverage falls further behind the environment. And as teams adopt AI-driven analytics, automated triage, and copilot workflows, those systems inherit the same data quality problems underneath them.
Better analytics do not fix weak telemetry foundations. They amplify whatever signal, context, and schema quality already exist.
Why this gets worse during a SIEM migration
These costs become more visible during a SIEM migration. For a period of time, many teams run two platforms in parallel, which can mean sending the same data to two destinations, paying for duplicate ingest, and maintaining two versions of detection and enrichment logic.
The bigger issue is portability. If filtering, enrichment, normalization, and detection logic live entirely inside one SIEM, they often have to be rebuilt or revalidated when the team moves to another platform. That slows migration and makes data quality problems harder to unwind.
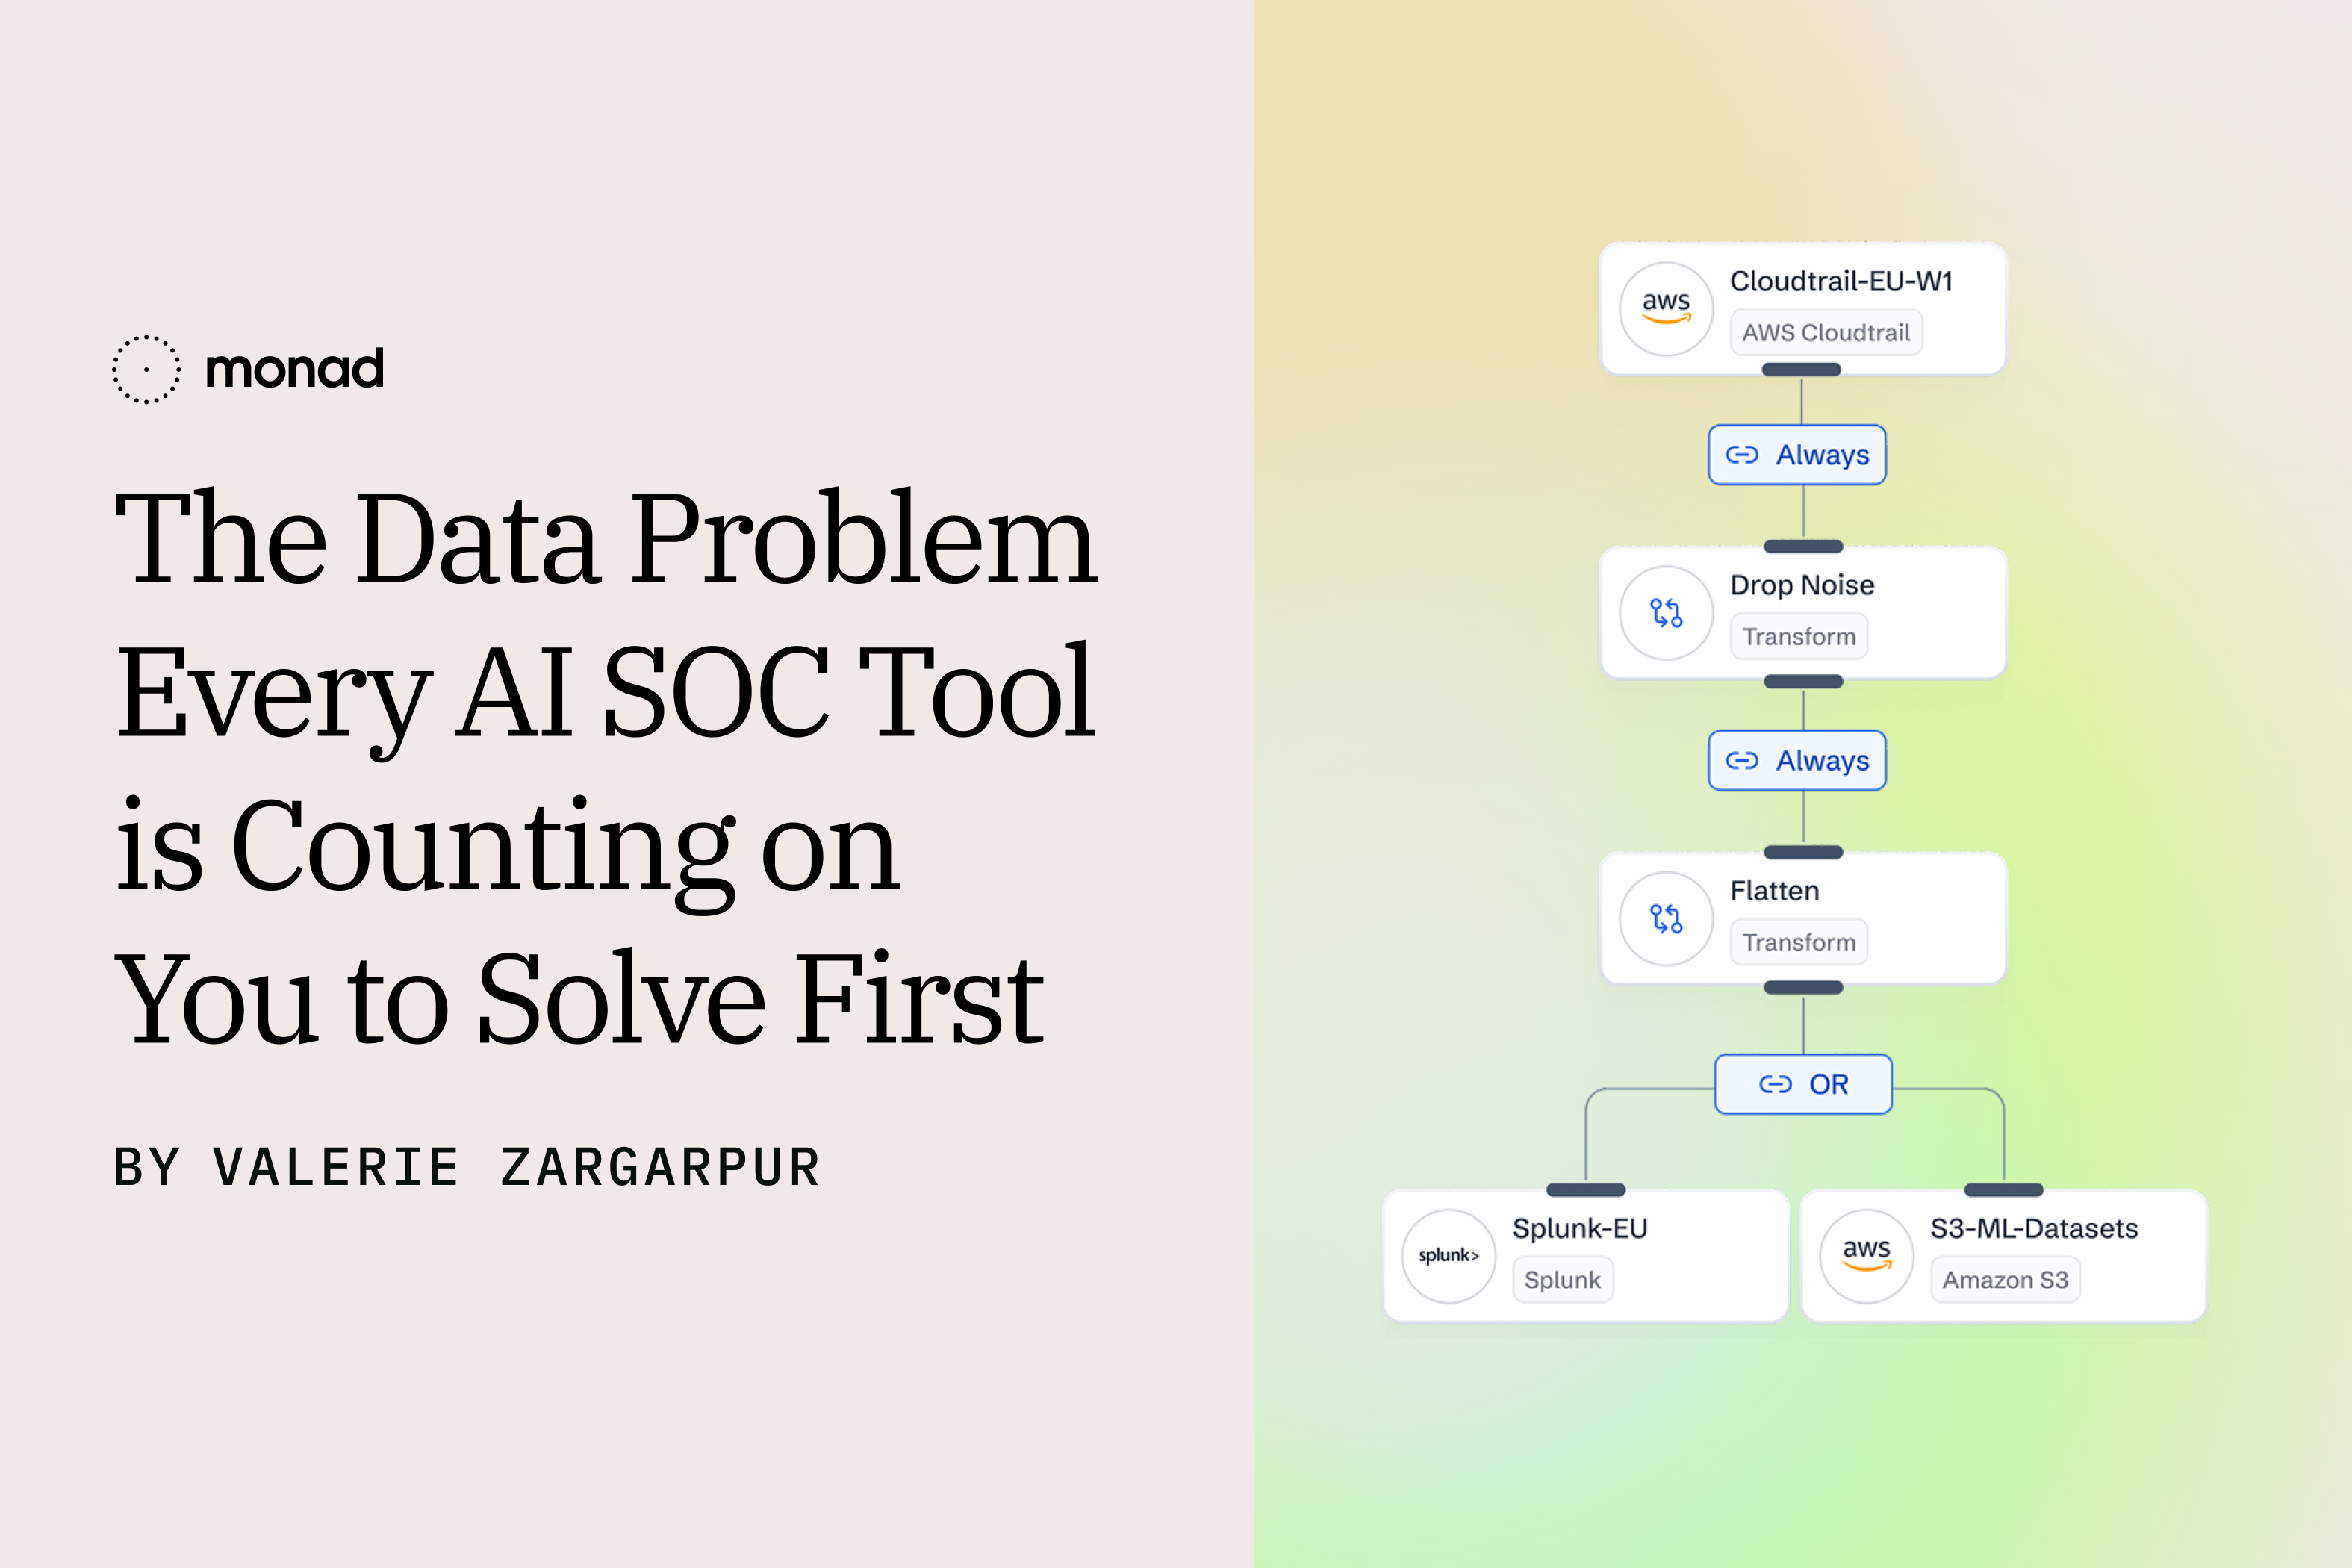
A pipeline layer changes the migration model:
The point is not that a pipeline makes SIEM migrations easy. It is that data decisions become less coupled to the SIEM itself. You can route to both platforms during evaluation, cut over when ready, and keep the same upstream controls in place.
What reducing these costs actually looks like
The practical move is to make data decisions before telemetry lands in downstream tools.
That means deciding, per source and use case:
- What to keep hot: data needed for real-time detection, triage, and frequent search
- What to retain cheaply: data needed for audit, forensics, threat hunting, or historical analysis
- What to enrich: events that need user, asset, identity, geo, or threat context before they are useful
- What to normalize: fields that need a consistent schema for correlation across sources
- What to reduce carefully: high-volume data that can be filtered, sampled, or transformed only after the team can test the impact and recover the original when needed
.png)
This is not just a cost exercise. It is a control exercise. Teams need to understand what each stream is used for, where it should go, what it costs there, and what risk is introduced when it is changed.
That is where pipeline visibility matters. Monad’s storage cost analysis helps teams model filtered versus unfiltered costs by source and destination using observed data volumes and the storage prices they configure. Before changing a pipeline, teams can estimate the cost impact, validate what would change, and decide whether the tradeoff is acceptable.
The goal is not to send less data everywhere. It is to send the right data to the right place, with enough context and control to keep detections, investigations, and retention workflows intact.
If you want to see what that looks like on your data, schedule a demo. If you want the technical walkthrough of the storage cost analysis feature, read the companion post: Your SIEM Bill Is a Lagging Indicator. Introducing Storage Cost Analysis in Monad.
Related content
.png)
.png)
Darwin Salazar
|
June 9, 2026